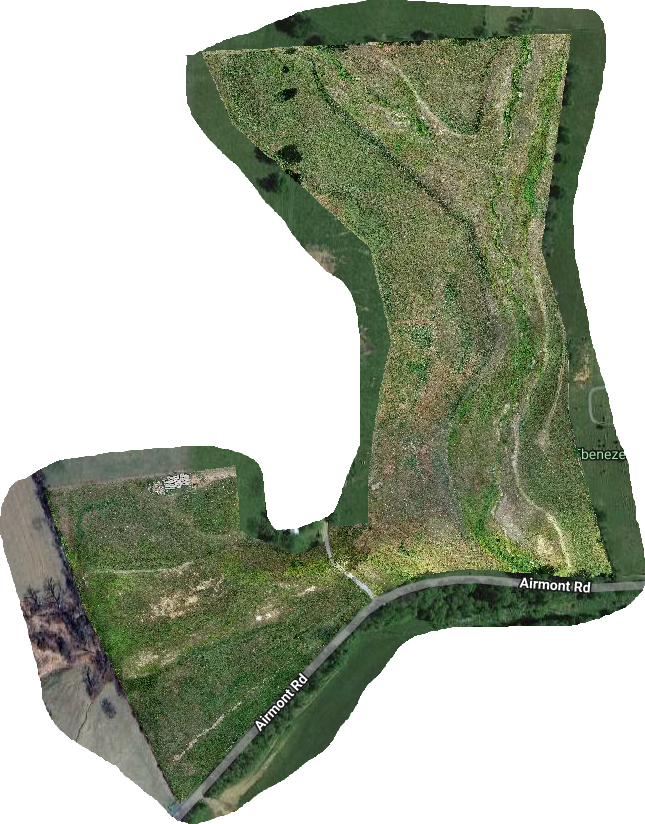
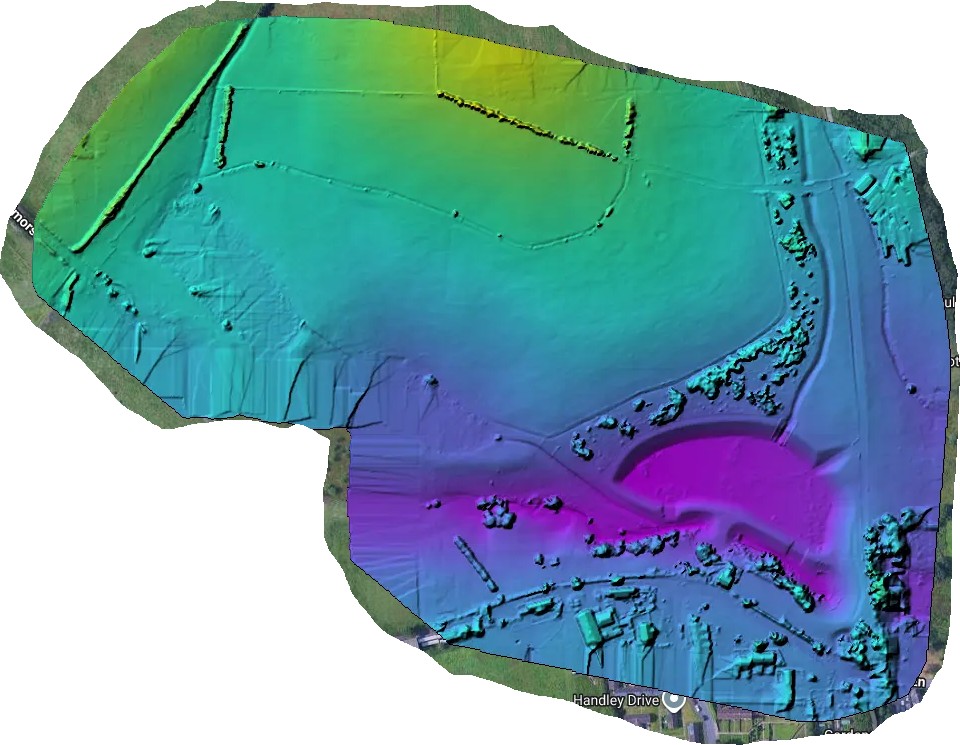
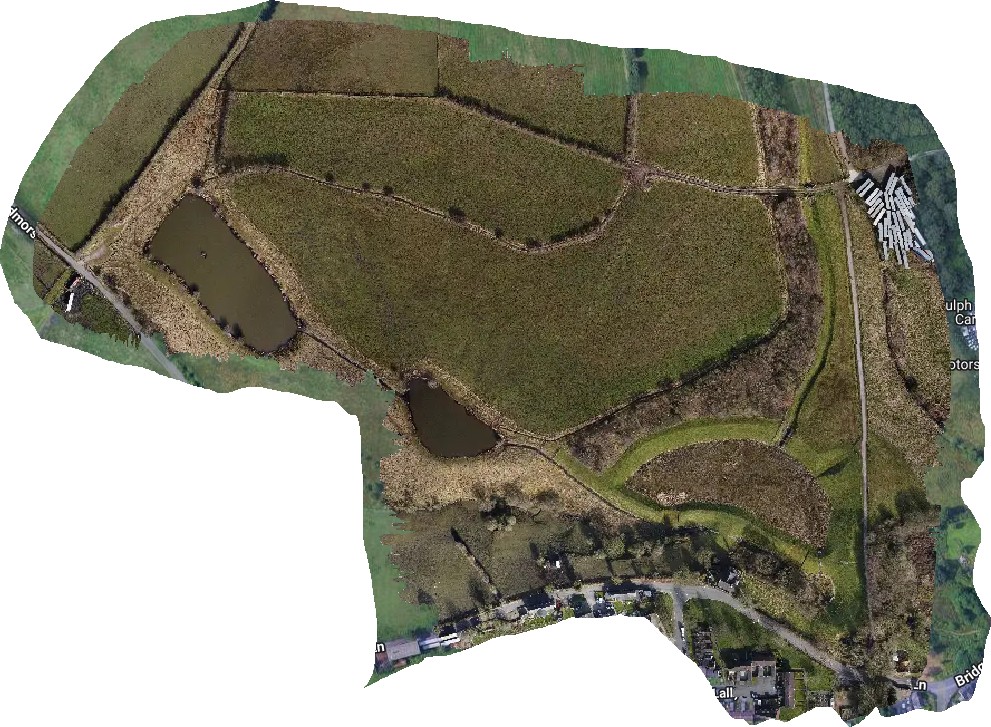
I was a bit inspired by @aeret and @alanterra and others on the request for images / datasets here:
So I thought I’d follow on: whether for posting on the website or just showing off for fun, what cool elevation datasets are folks rocking these days? Anything to show off?
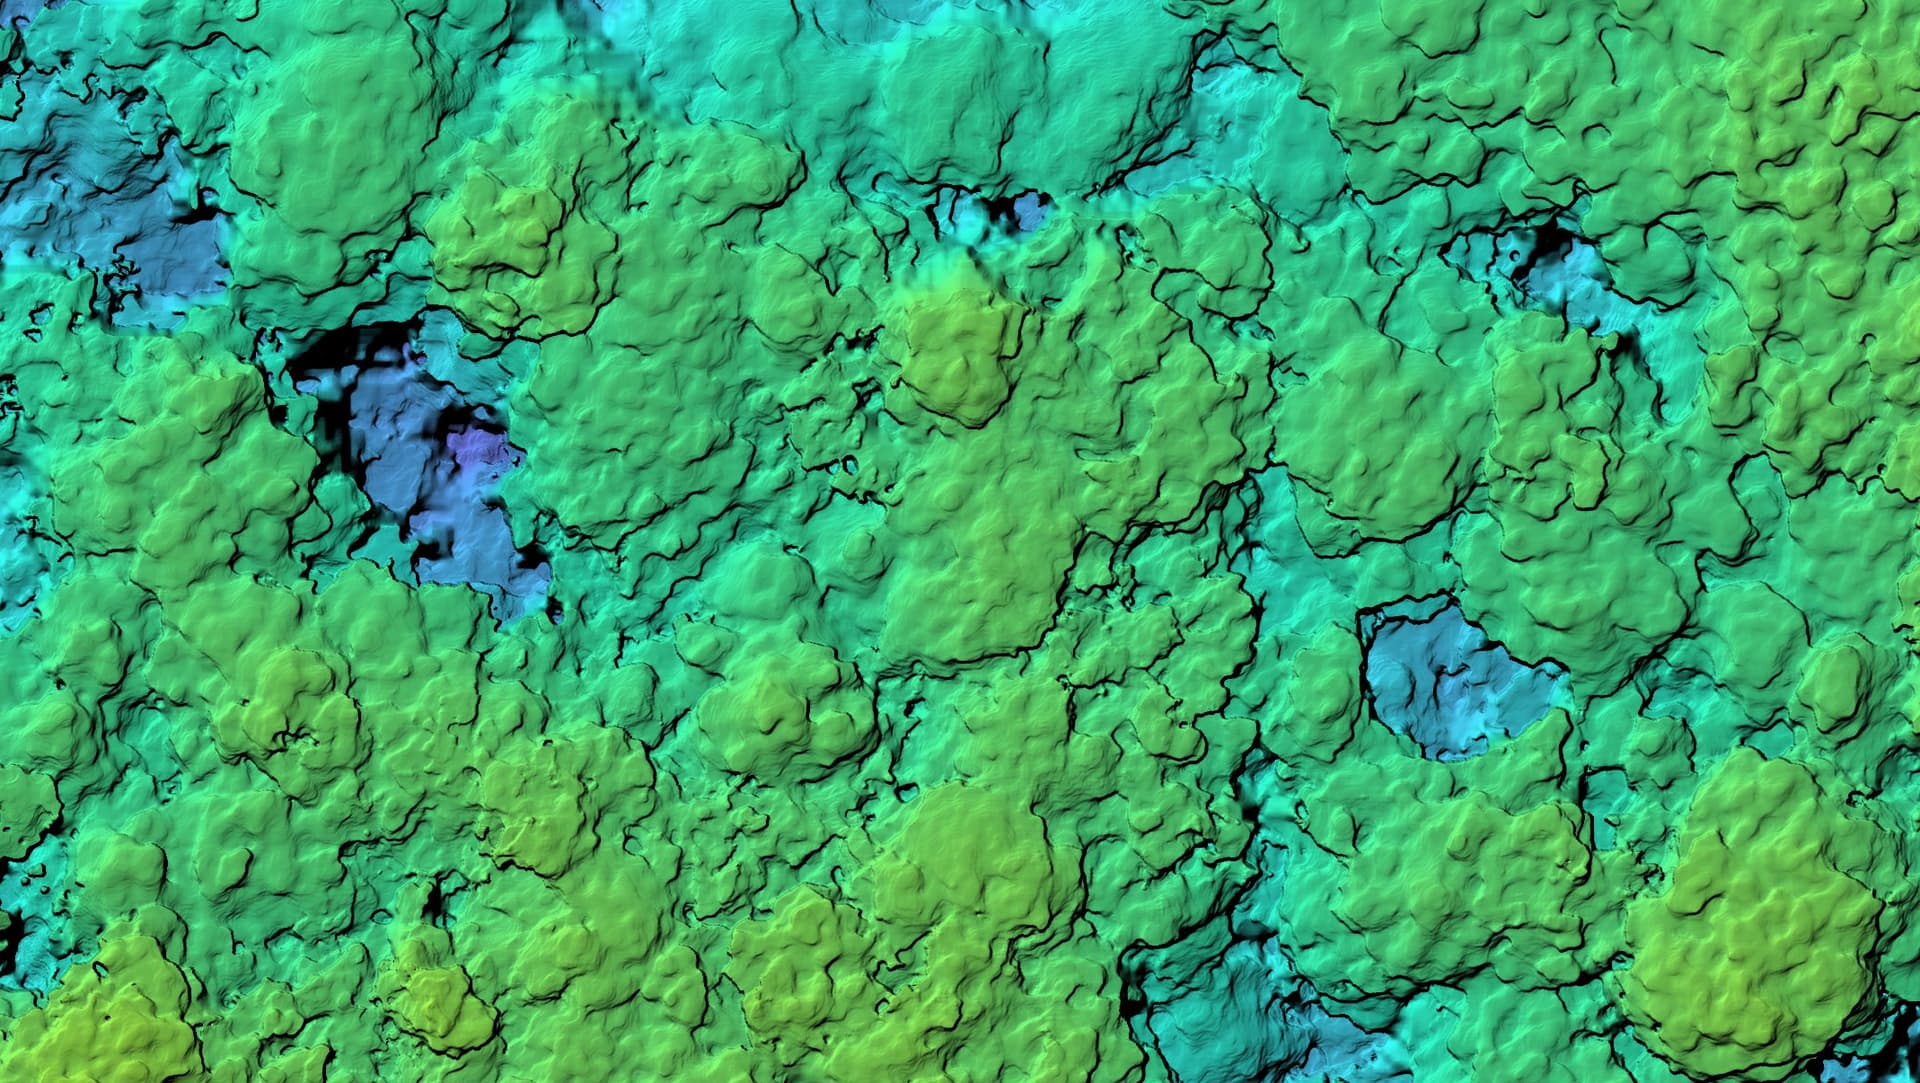
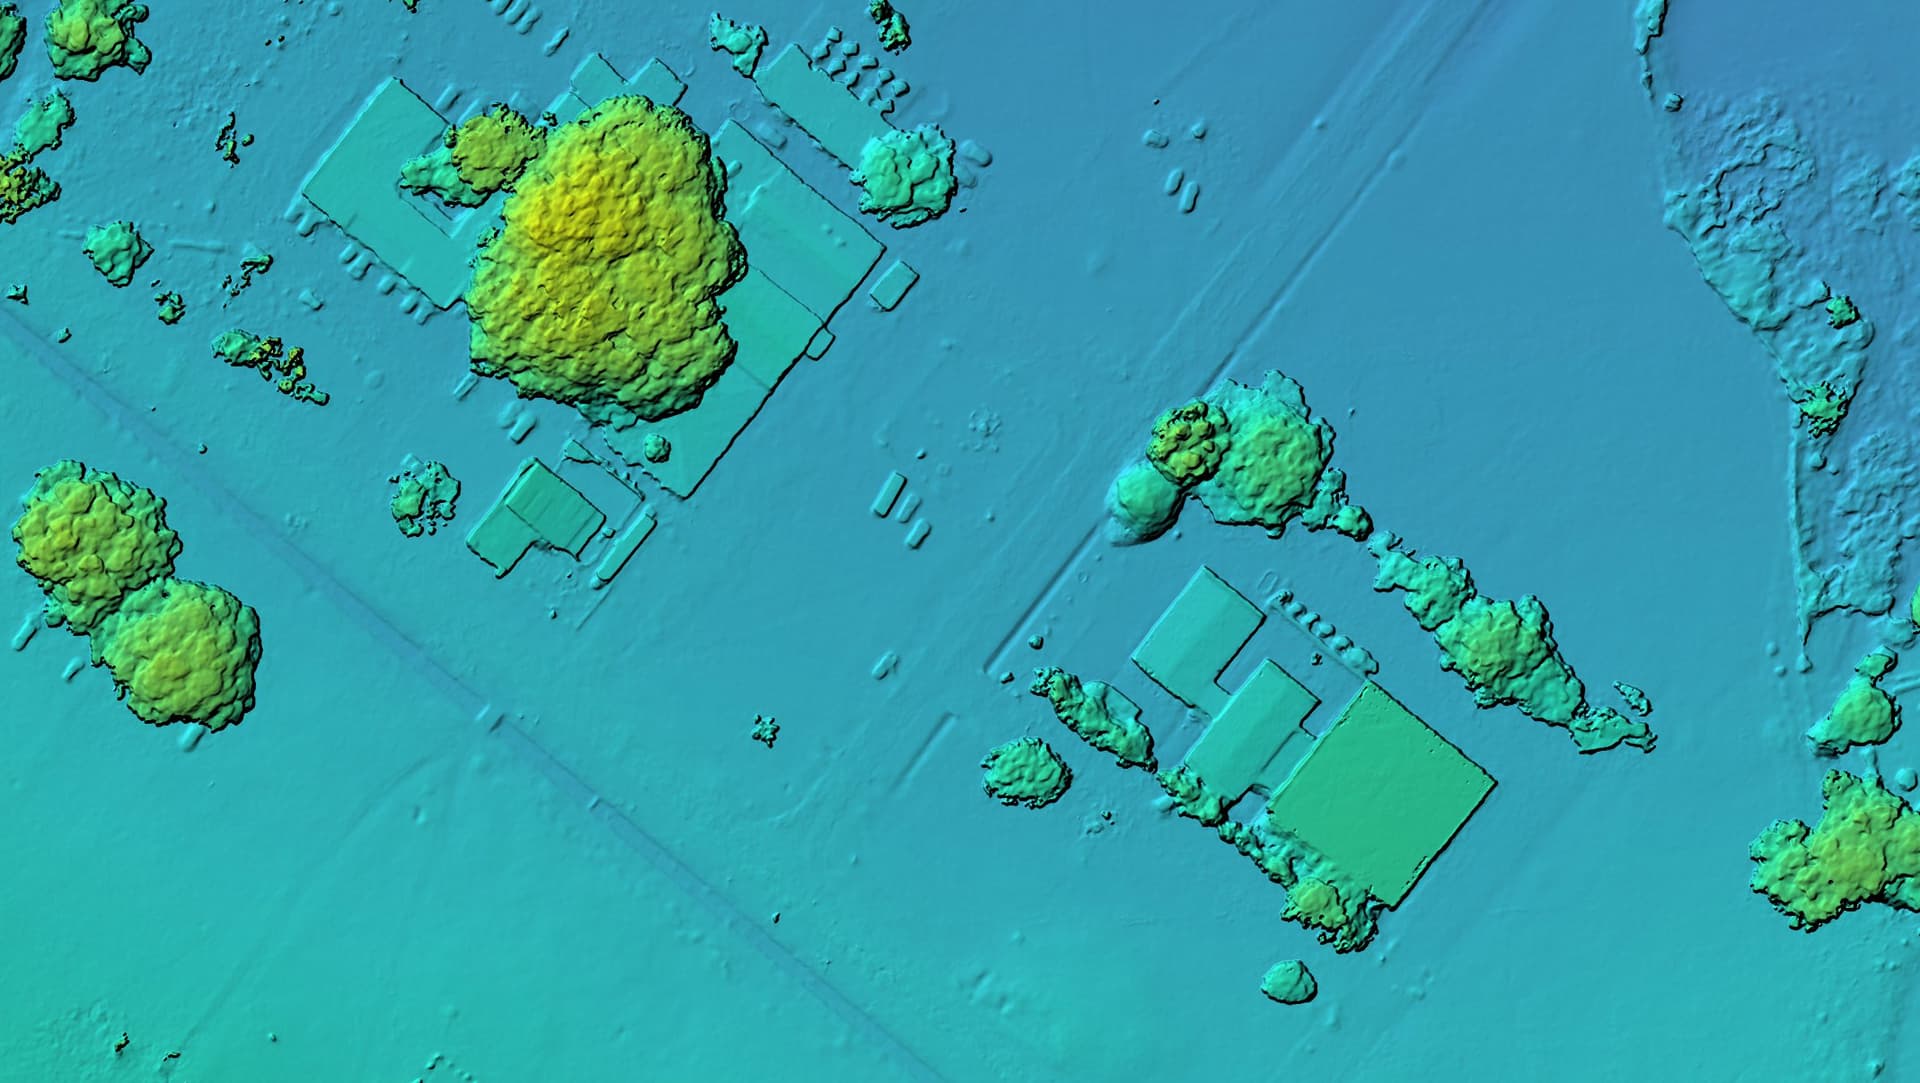
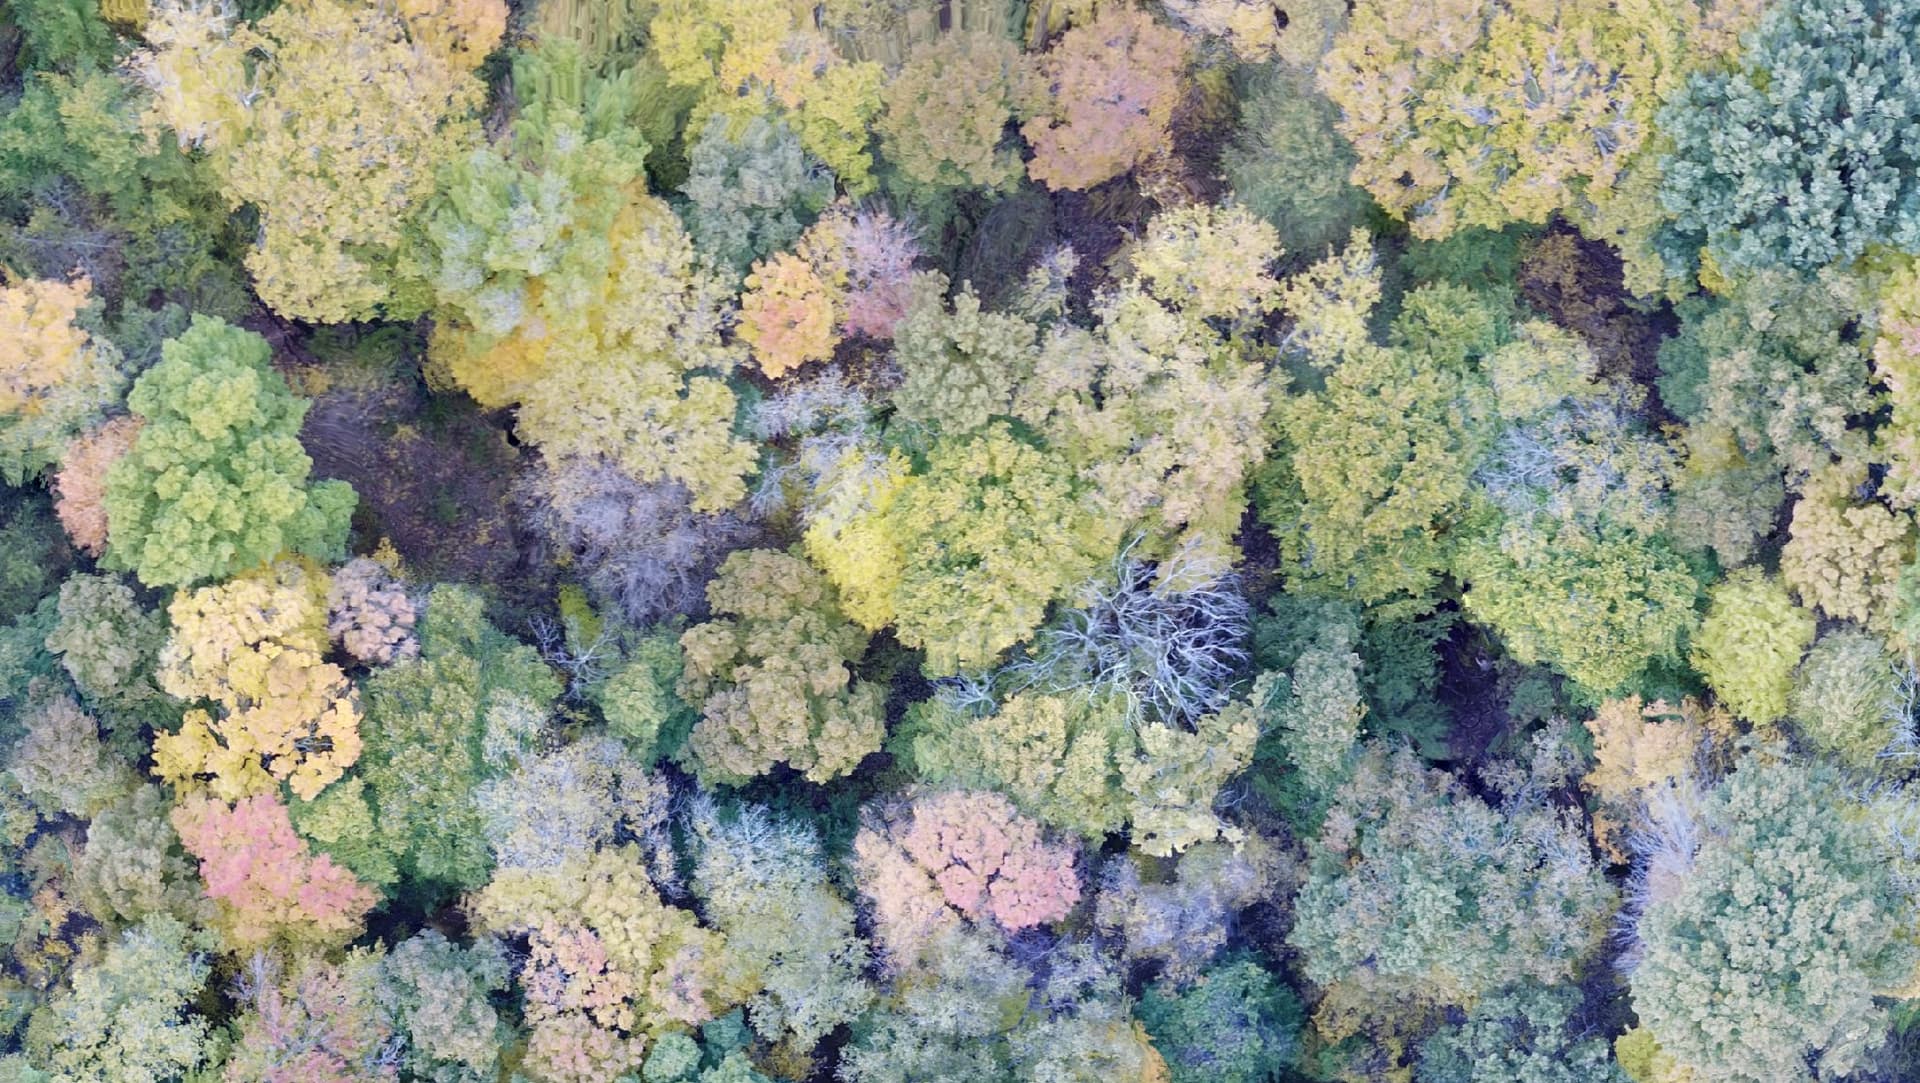
I’ll lead off. I really like DSMs of forest / tree canopies, so here’s one from near Cleveland Ohio in the US and another from University of Zambia in Lusaka, Zambia:
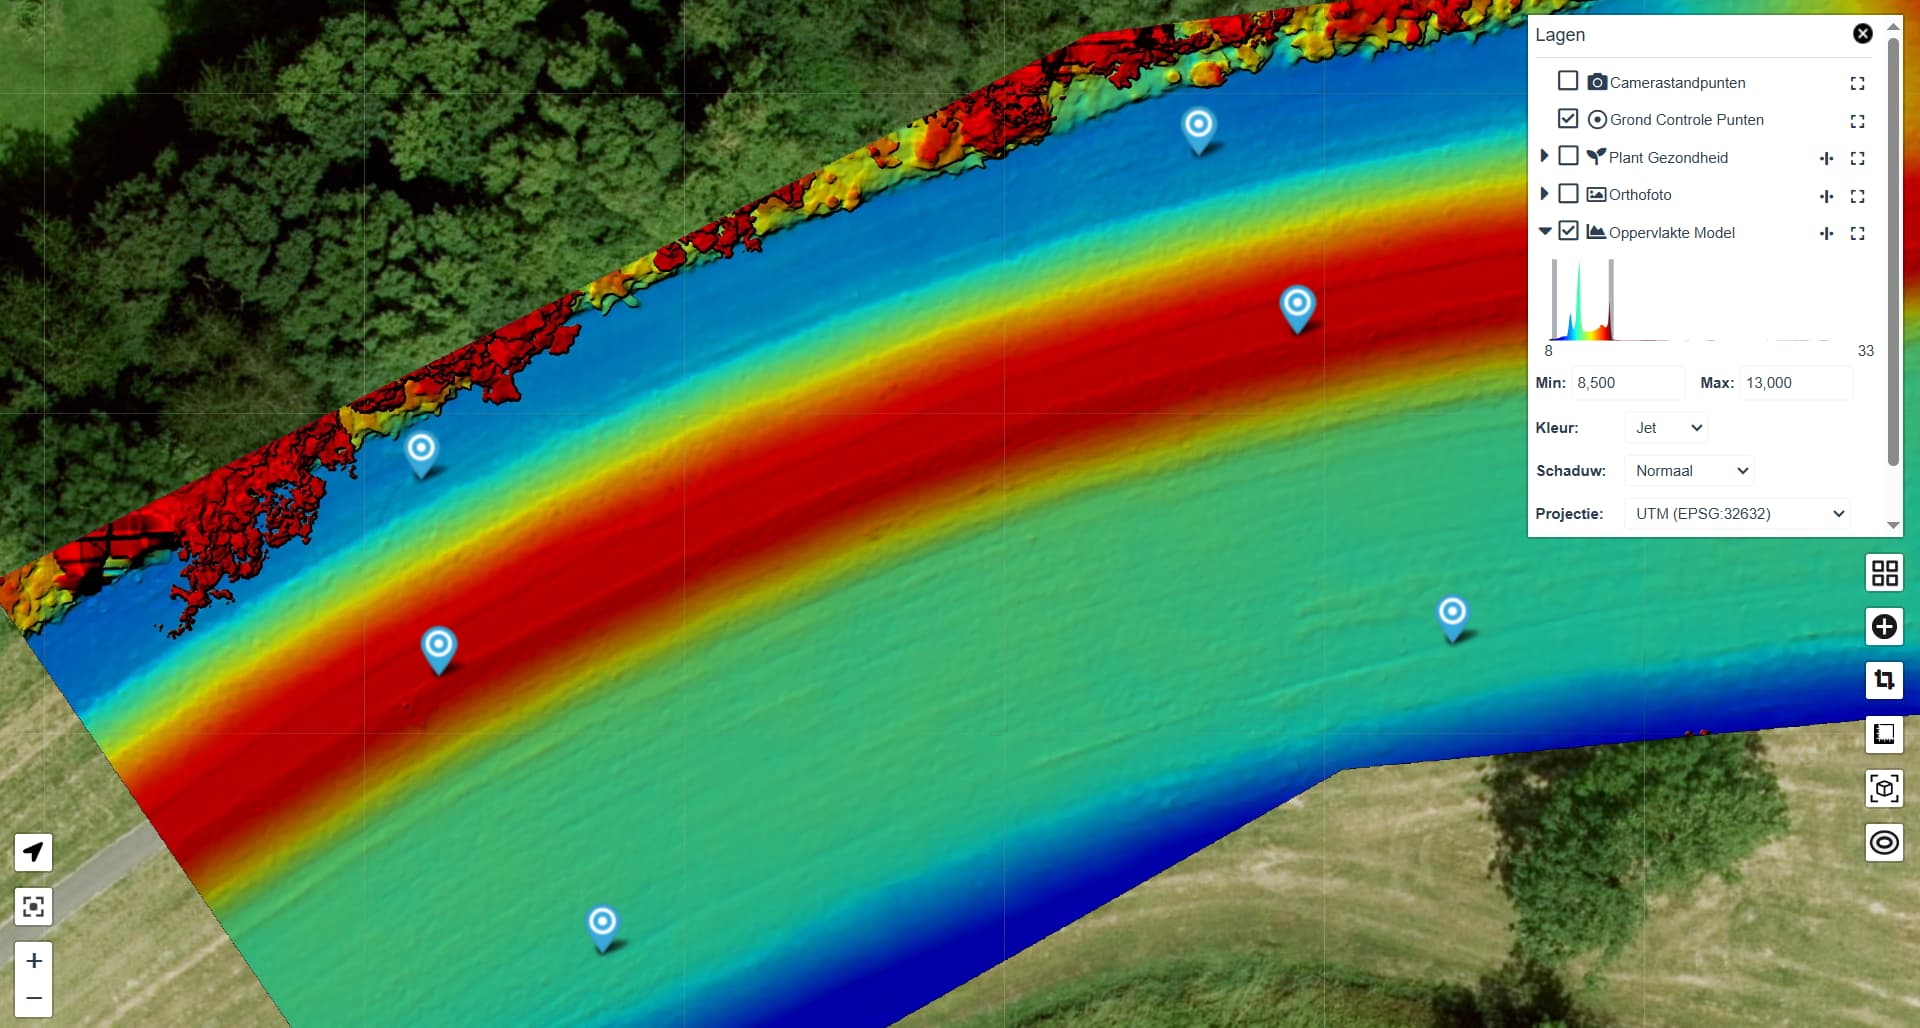
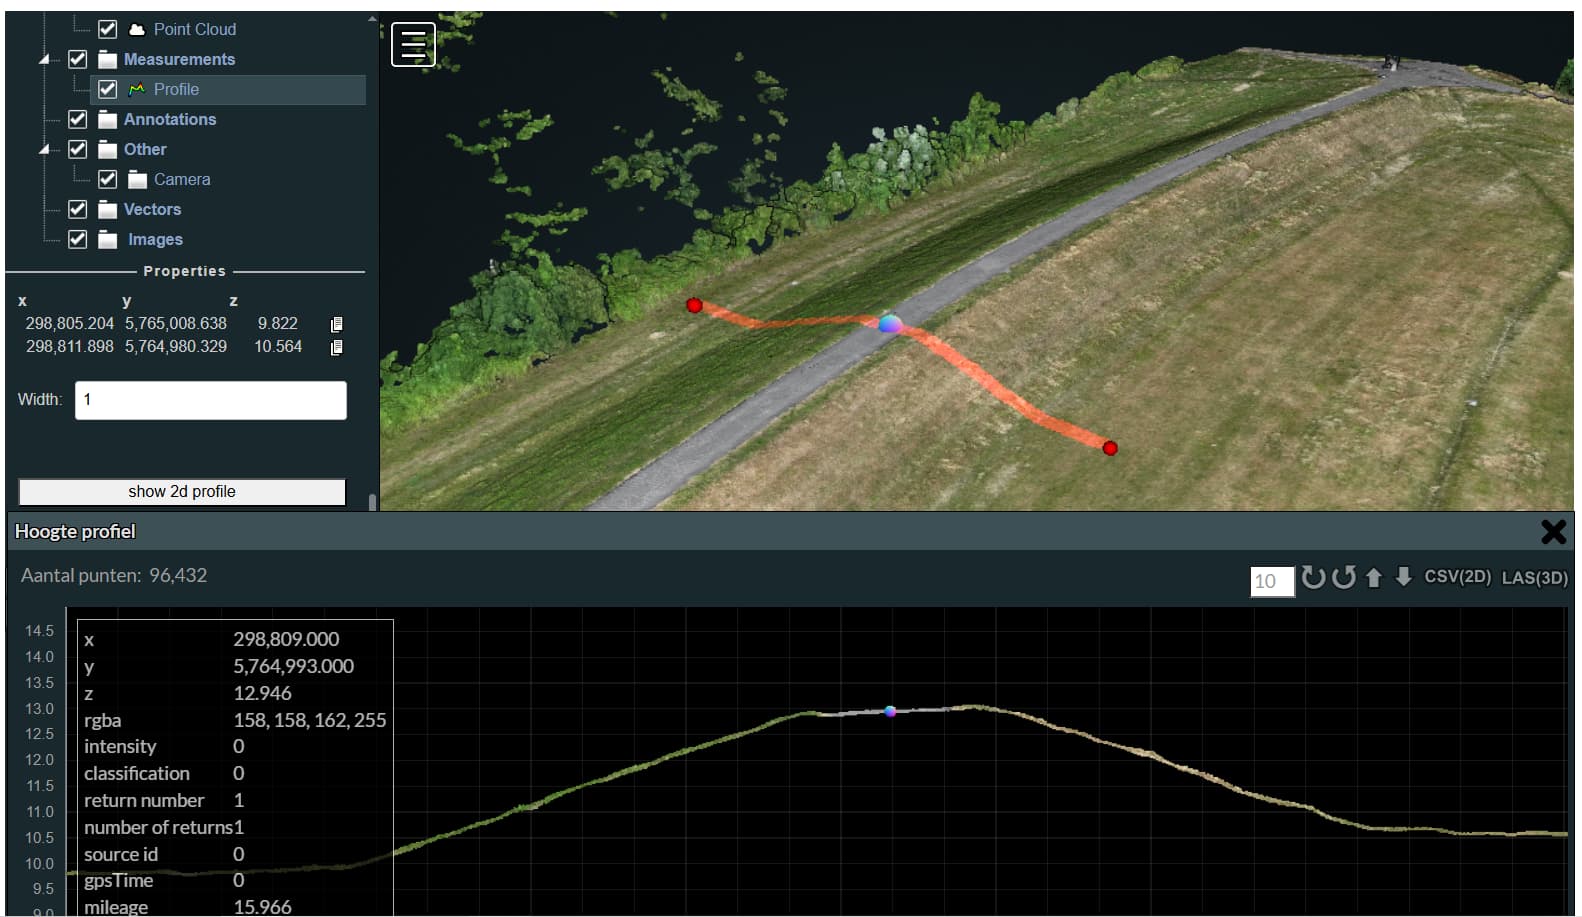
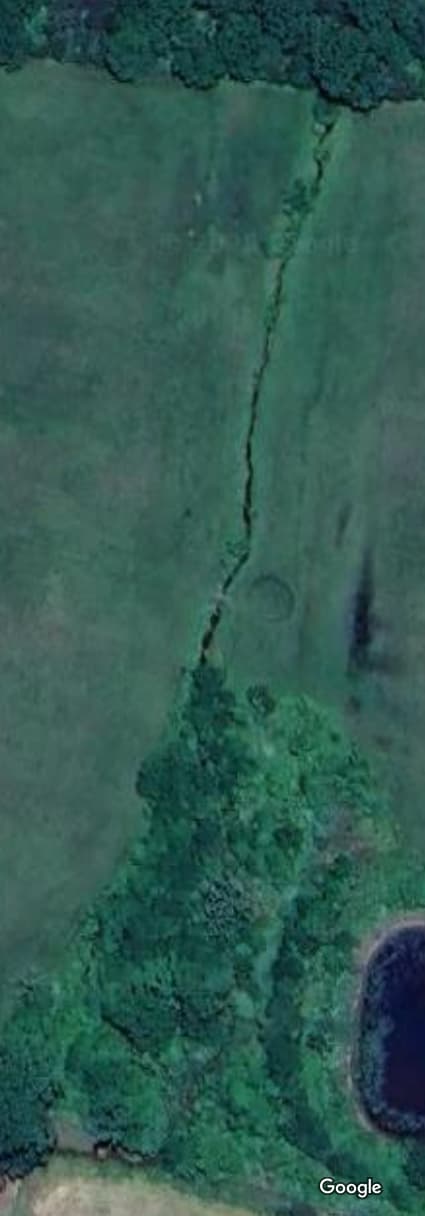
Although the Netherlands are pretty small compared to other countries we have around 17.000 km (around 10600 miles) of dikes, to prevent us from getting wet feet ;-). Some organisations already use drones to monitor the state of these waterbarriers. Think about visual inspections rgb, dsm, slope, profile but also vegetation monitoring.
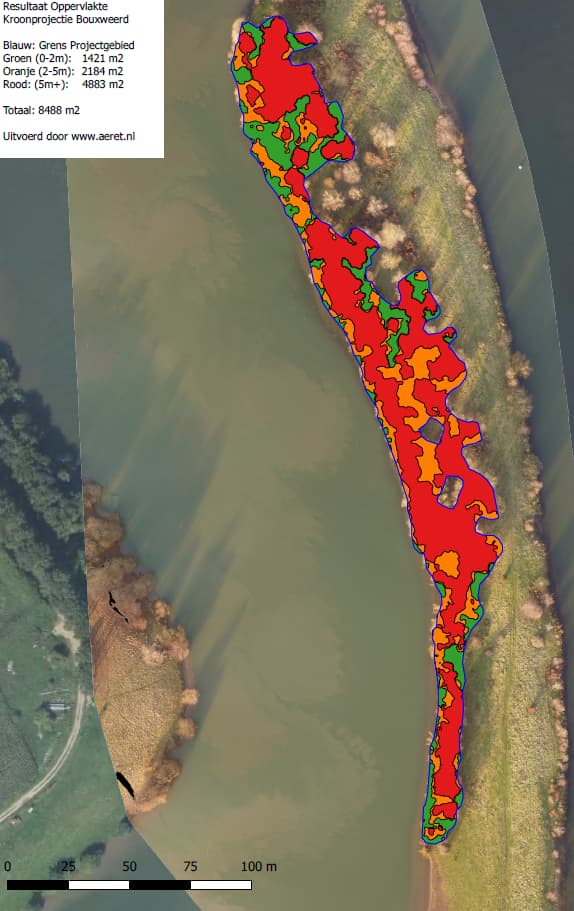
Not exactly a DSM, but how we used a DSM to do some area analysis.
What it was: A Rijkswaterstaat project focused on nature reserves along major rivers.
Objective: Reducing hydraulic resistance caused by vegetation, which contributes to improved water drainage.
We used drones to fly over (hard to reach) areas. Based on GIS data from the area-owner (thin blue line, area’s that may contain vegetation) we made ‘classifications’ of vegetation-height.
0-2mtr: ok
2-5mtr: area of interest
5mtr+: needs to be removed
Wow! Such a cool dataset. I particularly appreciate 2nd and 3rd order analyses on top of ODM data.
These are great. It has been fun when I have visited to walk / bike / hike with a hydrologist so I can have a slightly better understanding of the flow control structures throughout.
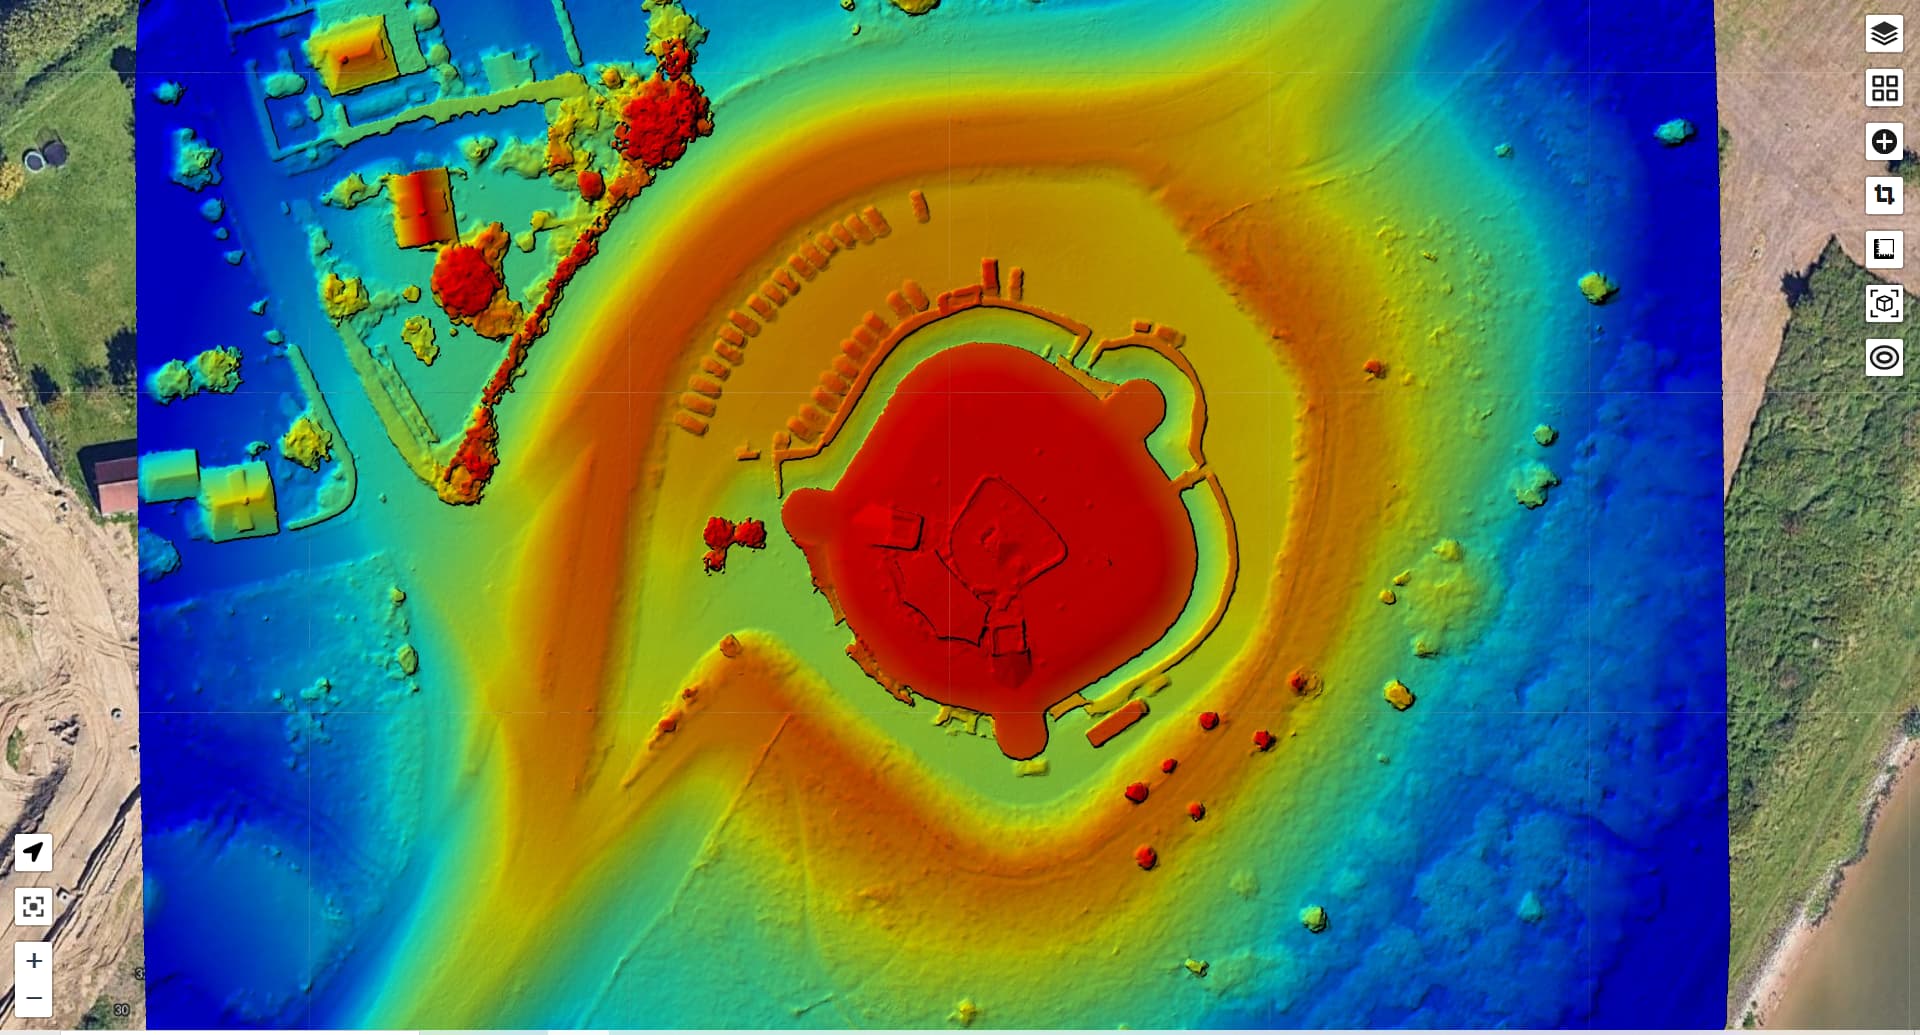
On some ‘strategic’ locations (in the past) Forts were built, to protect cities. Mapping these also result in a nice DSM
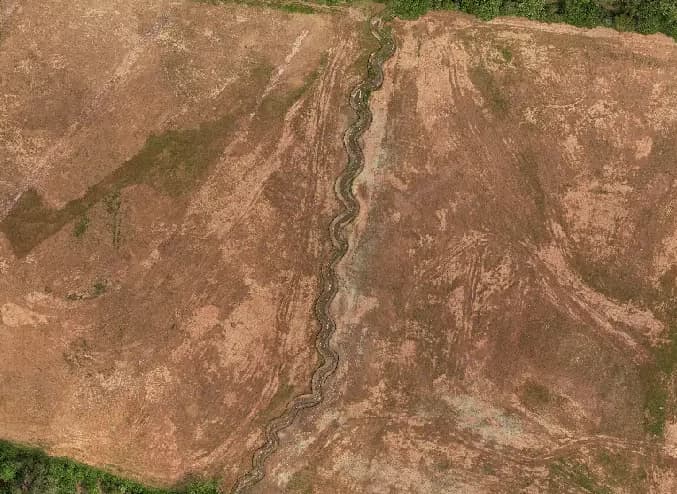
Ha! Truly. The shapes are quite something and the DSM of them really highlights the engineering.
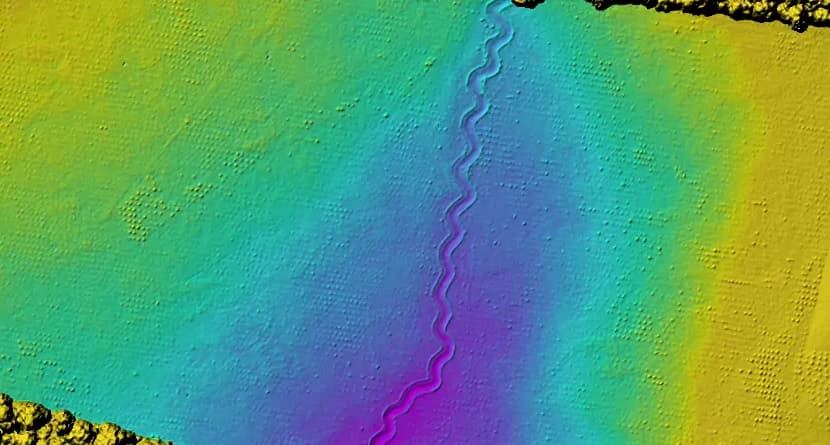
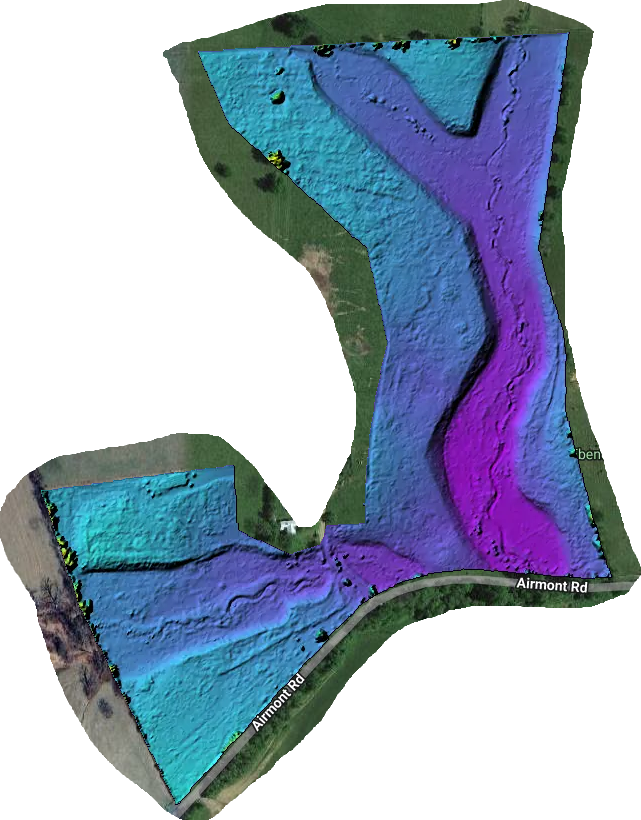
Yes the curves reshape the stream based on length of the stream and elevation difference from beginning to end plus a couple of other factors. they also will install features in the stream to prevent erosion of the banks
the rest of the site (about 35 acres) is planted with hundreds of trees. you can see them as the little bumps in the DSM. images were taken from 98 meters I believe. used GCP’s for georeferencing and accuracy.
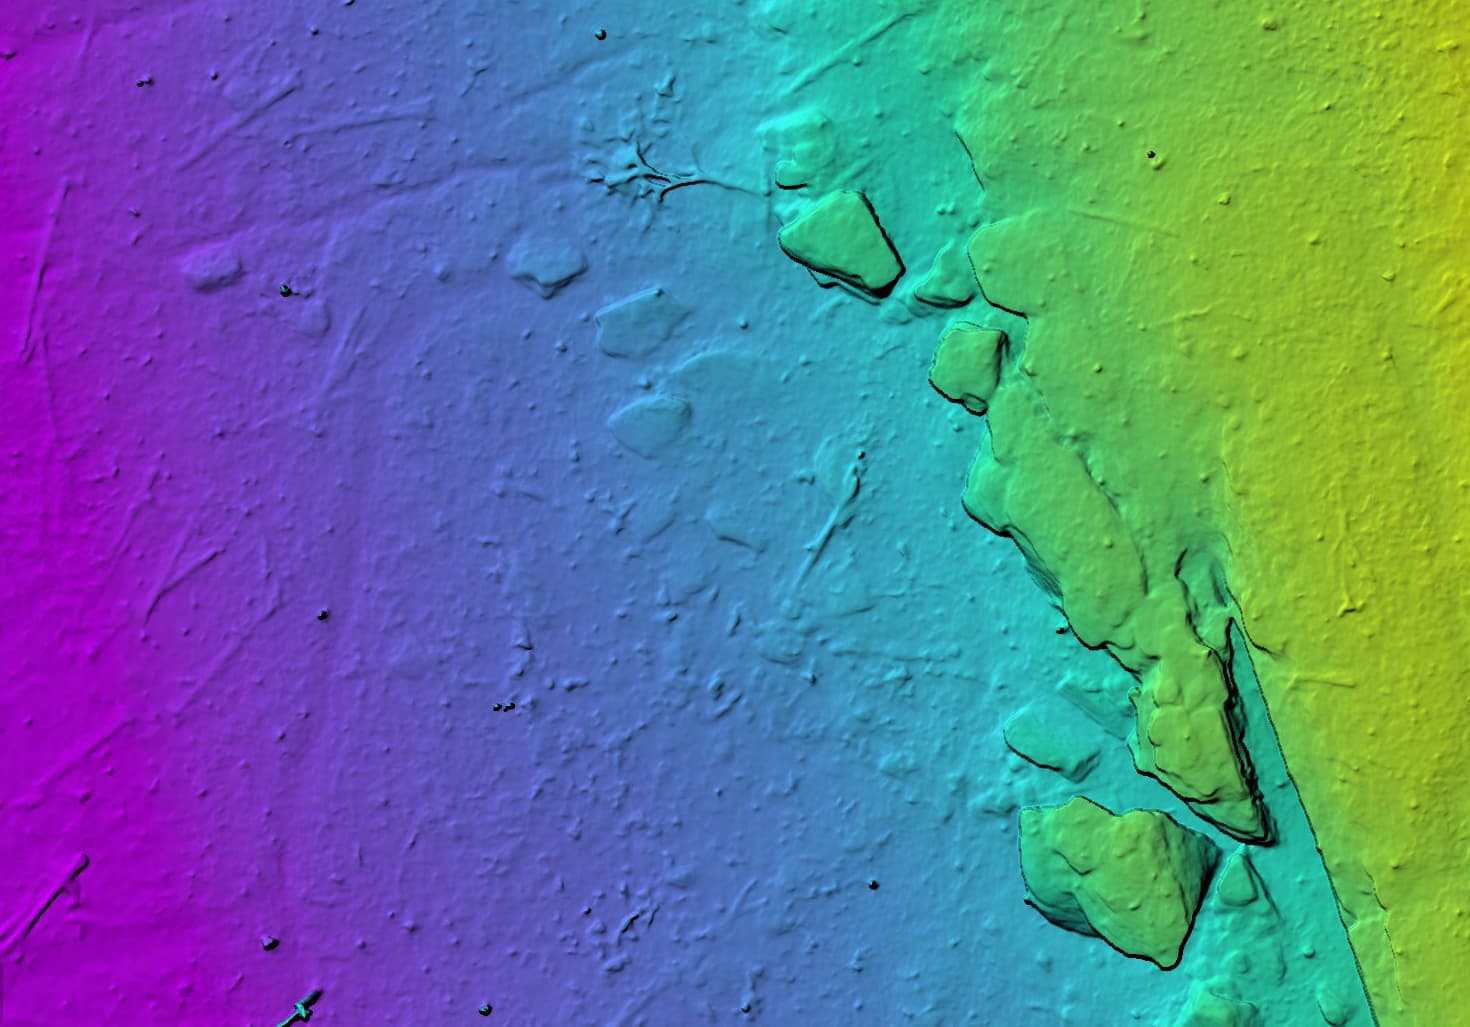
Here’s another that tickles my fancy. It’s a deciduous forested area with a cliff in winter, so the trees are hidden even in the DSM, but we can see a recently fallen tree in all it’s glory:
Another stream and wetland restoration site from 2023. Processed to the bank site boundary. GCP’s again used for georeferencing and increased relative accuracy.