I am using the WebODM to obtain the vegetation indexes from a drone orthophoto of a maize crop. According to literature (Applying high-resolution visible-channel aerial imaging of crop canopy to
precision irrigation management / Redirecting) the range for the Green Red vegetation index (GRVI ) is from -1 to 1 being green vegetation (index above 0), water and snow (index around 0), and soils (index below 0) .
But the reading I am doing to the index color image and its histogram shows me the greenest for those pixels for water and soil and the most red for those where the vegetation is abundant (besides the river -the dark green in the upper and right side of the image), letting me the yellowish for the maize crop with a gradient
I might change (invert) the color palette and have a congruent relation to the eye between color and elements of the image (red for soil and green for vegetation). But then is another problem if I want to do the analysis regarding the literature fundamentals, the numbers don´t match as the range of the GRVI states.
I wonder if there is something I am doing wrong or missing in the process that someone could enlight me?? Thanks in advance.
Thanks for your comment. I didn’t make any change in the bands. I Just used the plant health icon and I downloaded the raw file in order to have just one band. The input is set by default in the webodm software.
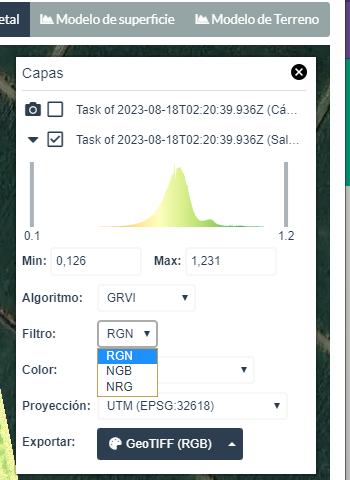
Thanks again for your comments. The sensor is RGB, it is not multispectral, nor thermal. The filters are by default in the Webodm, as you can see in the attached image. Is this filter affecting the pixel output number?
Thank you very much for your help. The issue was submitted. If you find something else that might be told in the issue, I will be pleased to include it.