Drone Deploy has this option to create a “plant health” output for orthophotos. I’ve been investigating how this is achieved. There’s a guy who probably has written it already to OpenDroneMaps:
I downloaded the photo he uses in the example and worked out how the calculations works on his Python program. It’s a simple calculation and it goes as follows:
(green - red) / (green + red - blue)
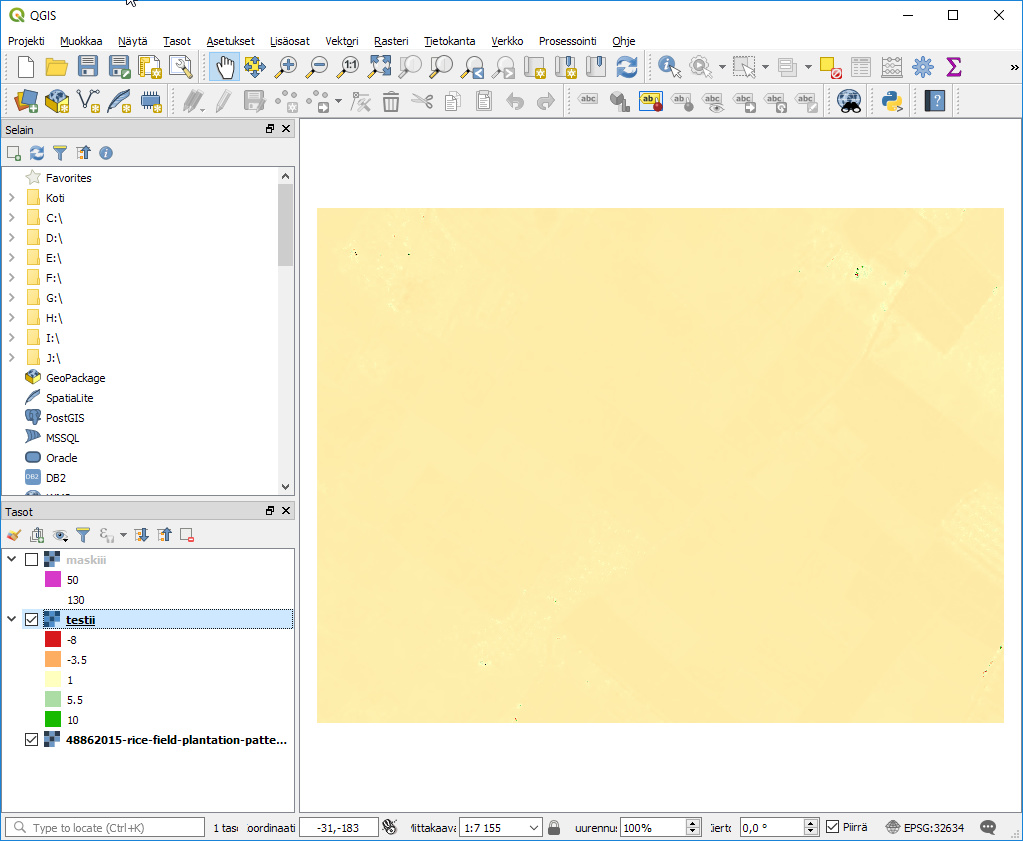
I was able to reproduce similar photos on QGIS using those calculations.
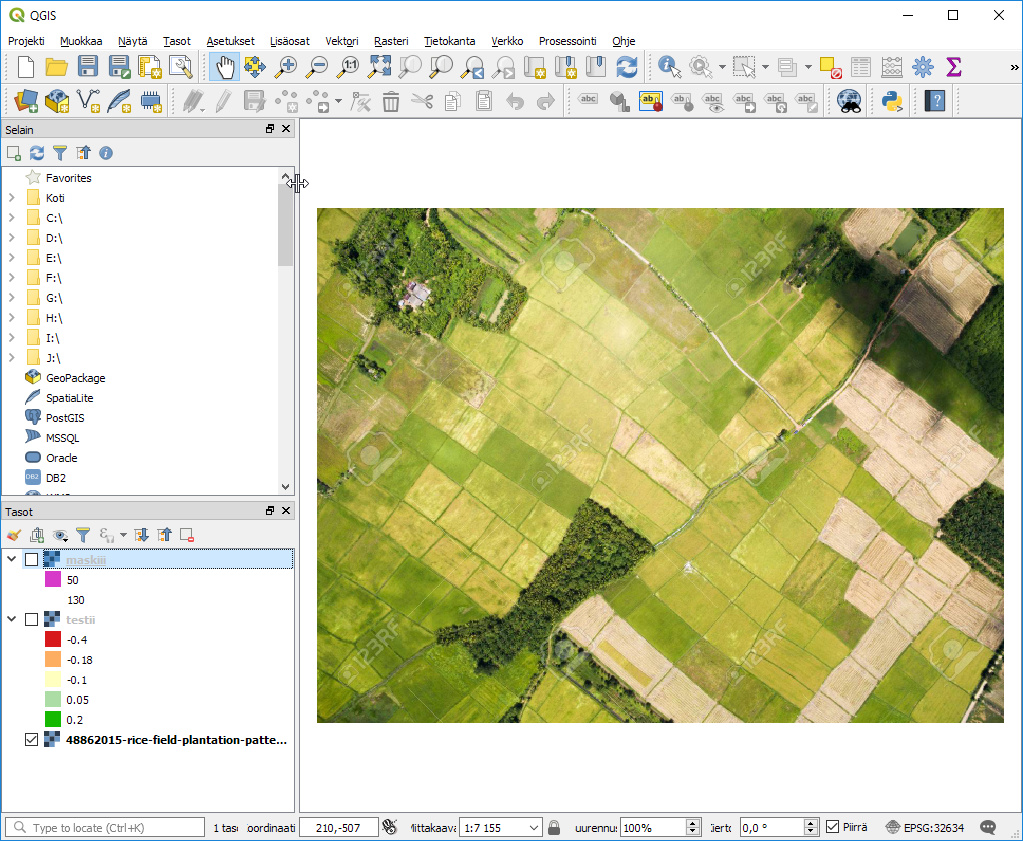
Then I went and downloaded a picture from web, and open it to QGIS:
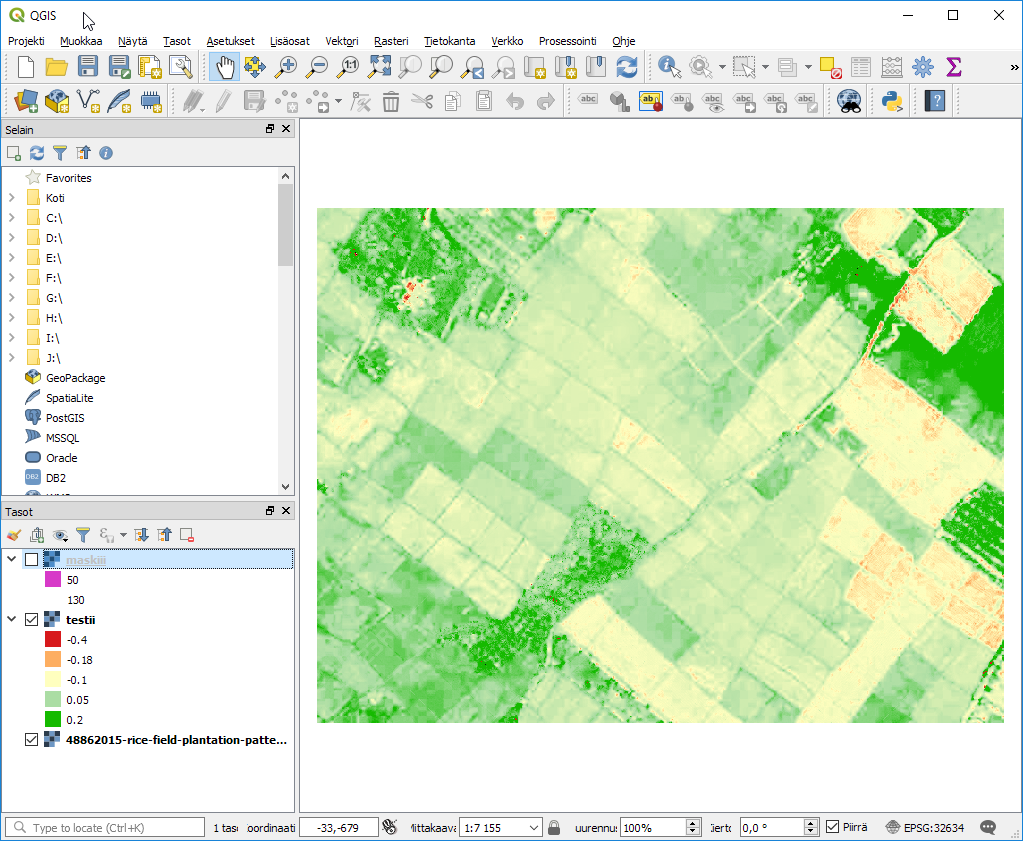
That output is pretty much like what Drone Deploy produces. And it has a problem with shadows, they are usually shown as very green. So in the Python program, there ware also calculation for a mask: (green + red) - blue =! 0 (not sure I got it right)
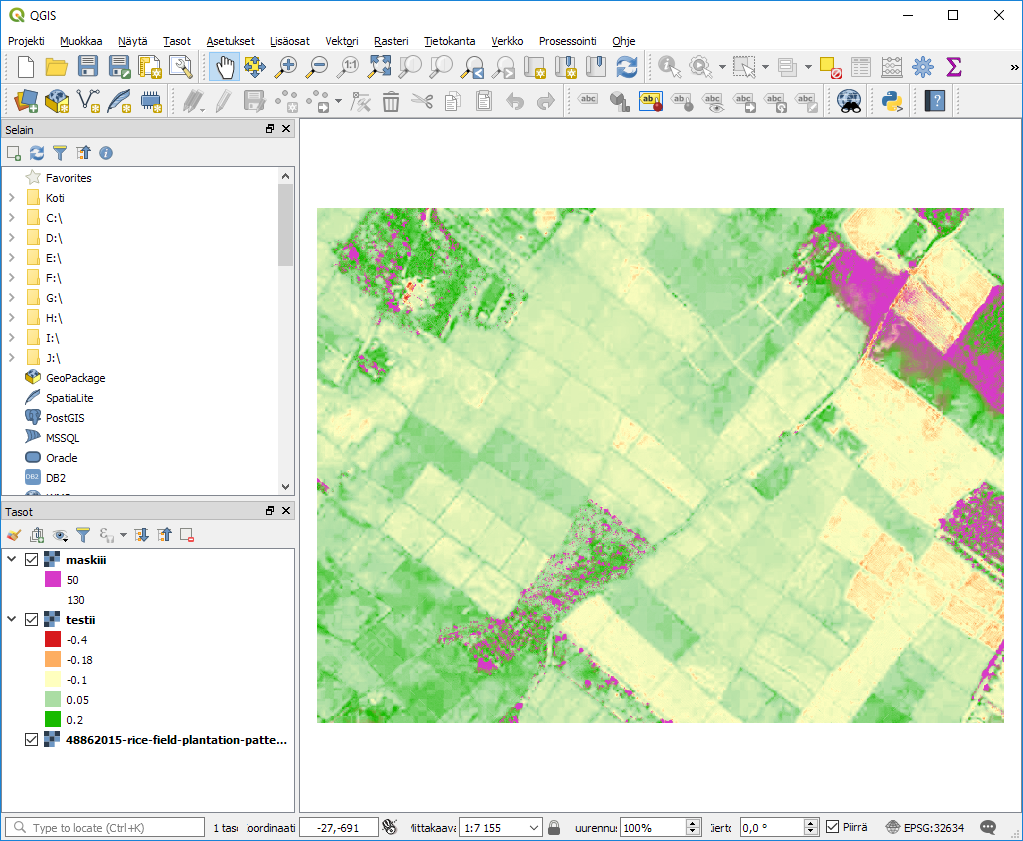
So I made a new Raster Calculation ((green + red) - blue) and made it pink. After fiddling with numbers, I then got it to mask out those shadow areas:
So I think that this would be pretty easy to add to WebODM, but it would need to have an interface for those adjustments. Drone Deploy has sliders for the colors, but not for the mask.What do you guys think, would this be a beneficial add-on?
Hi @ekto – this is really exciting. You might add it first up stream to the command line contrib module that does some vegetation index work already: ODM/contrib/ndvi at master · OpenDroneMap/ODM · GitHub and then lobby for it to be added to WebODM.
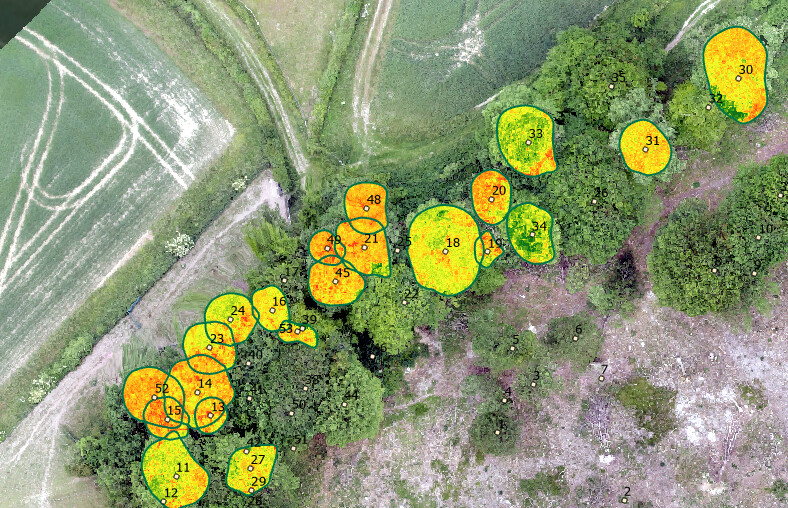
Hi I am using an RGB camera in relation to forestry and processing survey images through ODM, which by the way, I think is overall excellent alternative to others like Pix4D. The use of vegetation indeces in tree canopy health is of great interest - particularly in relation to Ash die back for the voluntary project I am working on. The NDVI result is very promising as you can see from the Ash canopy mapping below, but I am wondering how the NDVI has been calculated as it was from an RGB camera and hasnt got NIR band capture? It would be useful before I present findings to the estate manager to understand the bands used in the assessment. Any help on this would be greatly received and help my understanding.
With RGB, like in my example, the only source for those calculations is the green band. And the result is also only relative, not absolute. Meaning that you need to adjust the band so that what you consider healthy is mark as healthy, and things that are not so green are less healthy. The colour is dependent on sun light and shadows, so you can’t apply it to different images without adjusting. I believe that you get best results on overcast days since there are less contrast in images.
Hi Thanks for your reply. Yes this was taken in overcast conditions with minimal shadow earlier this year. Relative comparison is ok between the Ash canopies is acceptable. I just clipped the NDVI tiff to the Ash canopy polygons. What I’m not sure is in WebODM the process used was NDVI and not sure how this is so as I have RGB and no NIR in the images.
Hi, glad I found your post because I am wondering exactly the same thing. I have a mavic mini which has a RGB camera - how is NDVI calculated from only RGB visible spectral bands?
Thanks for that, good to know and makes sense to me. I have calculated and analysed NDVI using satellite imagery in the past, and am pleased to know there are other vegetation indices that can provide similar information using visible bands only.