I’ve been watching Windows Task Manager as I try my first few projects with WebODM - in hoping to identify bottlenecks I might be able to alleviate to reduce processing speed.
Shortly after processing first starts, CPU, GPU and RAM usage are all really high for a few minutes. It’s so high that my UPS issues alarms about the wattage the PC is drawing.
But not long after that the WebODM process settles down to what appears to be fairly low resource utilization.
I expect my current project to take about 24 hours to process - 1000 24mb images, not resized, and rolling shutter processing. Task manager says there is so little load on my PC that I could process a couple of jobs like this simultaneously.
I’m really curious to know what the processing bottlenecks are - so if changes to hardware or operating system options can reduce run-times - I’d like to have the opportunity to make those improvements.
All defaults except rolling shutter and not resizing images.
If there’s a processing bottleneck, wouldn’t there be evidence in utilization?
Task manager has limitations - but it can be a good place to start.
The WebODM hardware requirements list far more memory than Task Manager shows in use. So I’m wondering what I’m missing.
For what it’s worth, the processing times are good when compared to my experience with Pix4D. But with Pix4D, usually one of the hardware resources displayed in Task Manager is maxed out.
Not all stages are multithreaded so for those parts is good to have good single thread performance, a cuda enabled gpu will also help.
And you can have a lot shorter processing time by disabling things you don’t need as output, like a mesh in my case. Using Hahog instead of Sift will speed up matching significantly without much difference in quality.
I had been thinking about processor speed and it’s effect on non multi-threaded performance.
When I observe this phenomena in other software, you can see cpu utilization peak on different processors in Task Manager. Typically the peak moves from processor to processor.
I’ve not observed that with WebODM. None of the processors show higher utilization than any other while WebODM is processing.
So I was guessing that the bottleneck might be somewhere else.
I’m not sure about task manager, but when I observe use on Linux, during the single threaded portions, we’ll see a core run at 100% for short periods of time, before another core takes over at 100%, but it changes cores often.
However, if you aren’t seeing a single core used, your own machine’s bottle neck could be RAM utilisation. Cores will remain idle while data is moved to and from swap/virtual memory.
Overall, this is a topic that comes up periodically, and there are no trivial solutions to multithreading what hasn’t already been multithreaded. But as a free and open source project, we do accept contributions. If you’ve got the expertise, interest, and time to commit to looking into squeezing more performance out of portion(s) of the tool chain that are still single threaded, we’d welcome that.
That said, if we are performing as well as pix on similar hardware, I’m happy to know we aren’t wasting as much energy on resource use.
There are a few times - mostly early in the processing, and late in the processing, where all the resource utilizations are very high: CPU, RAM, GPU, Disk, etc. But for the largest stretch in between - the job appears to take no more than 20% of any single resource.
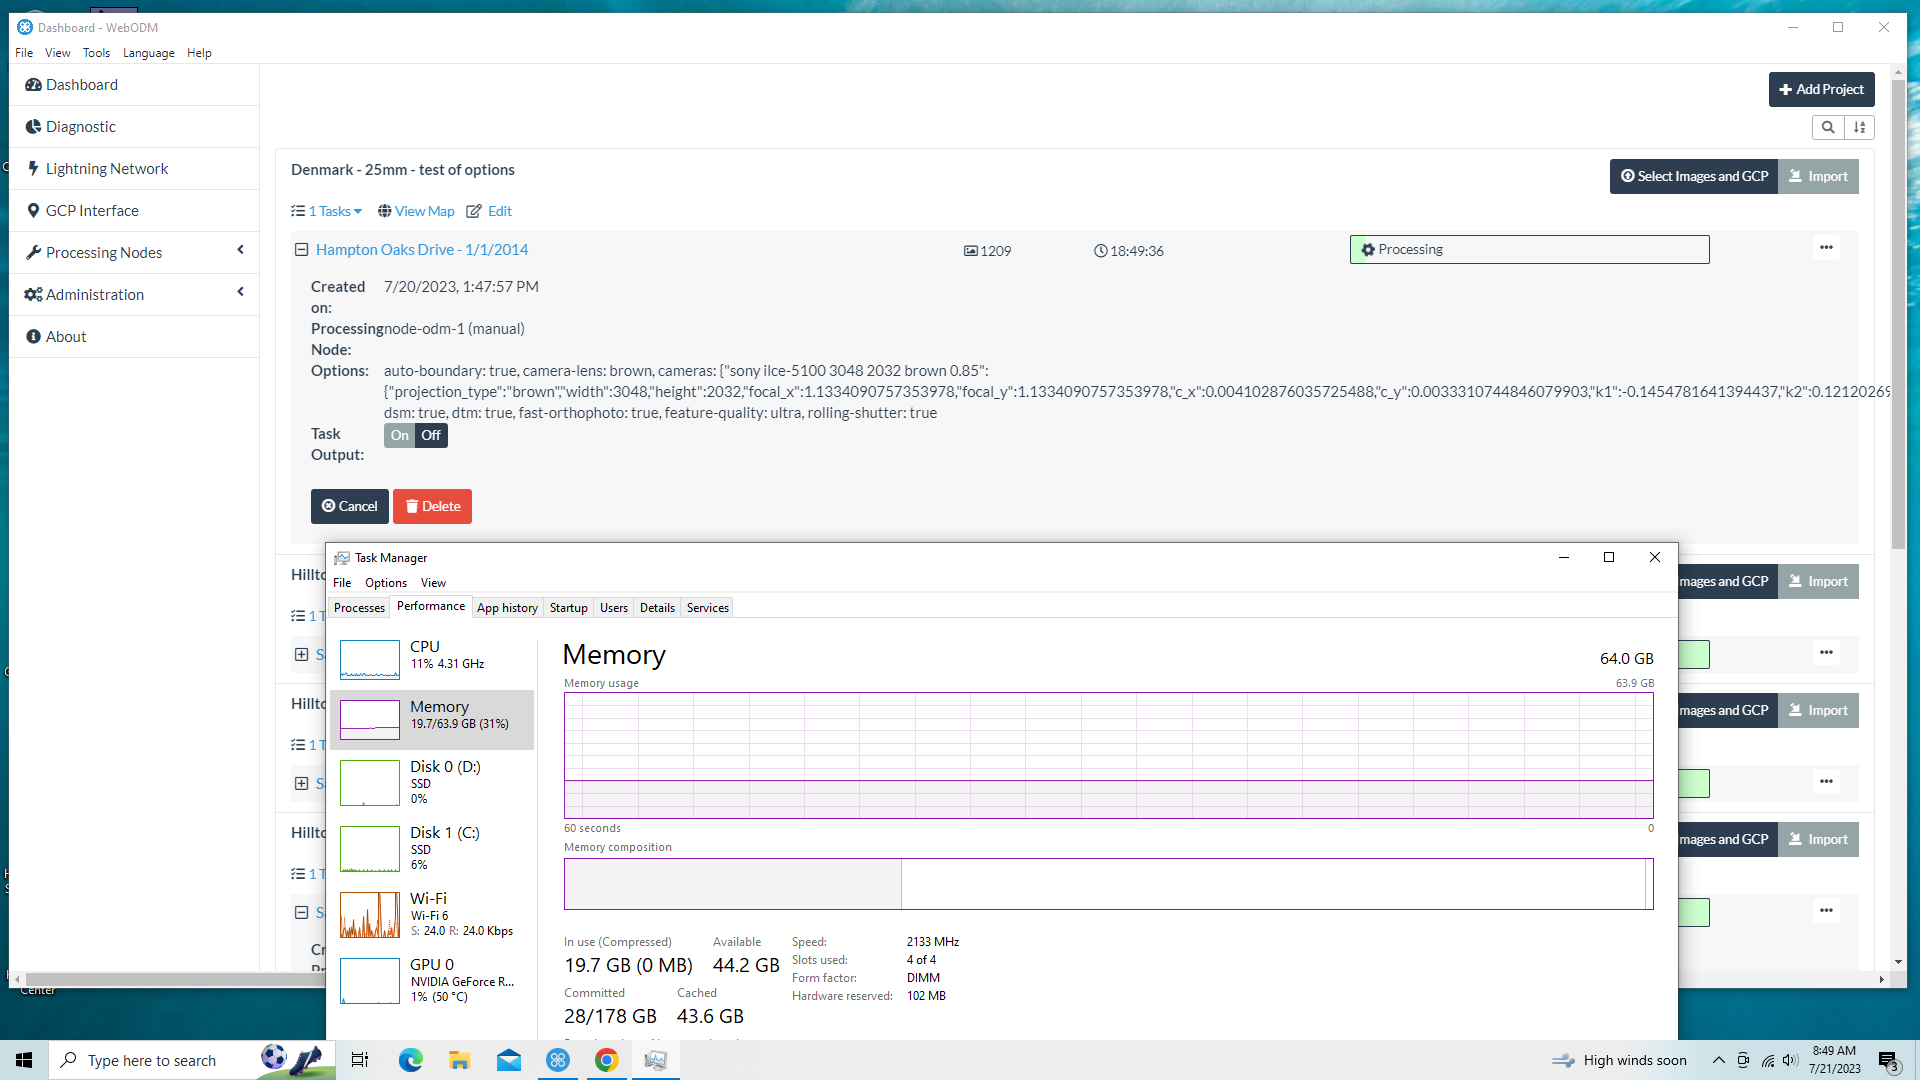
I’m coming up on 19 hours of processing - project options and resource utilization is displayed in this screen shot. The project includes about 1,100 images - 24mb. (6000x4000) I’ve reduced them down to 3048.
I’m still trying to figure out why WedODM won’t let me set “3000” as the image size.
19 hours isn’t unusual for large datasets. Faster core speed and more ram makes things go faster.
Have you tried a smaller subset per Saijin_Naib to look at utilization? That will help us discern if it’s a RAM limitation, which is somewhat likely with 1000 24mp images on 64GB RAM.
Also, it looks like a full core is currently in use: you’re using 4ghz. How many cores do you have? It’d be helpful to see your core usage tab. RAM monitoring doesn’t mean much as it’s never particularly accurate on any platform.
I have no complaint about the processing time. From my couple years of dabbling with Pix4D, the project processing with WebODM seems on par - and as there are more options available for processing - potentially faster.
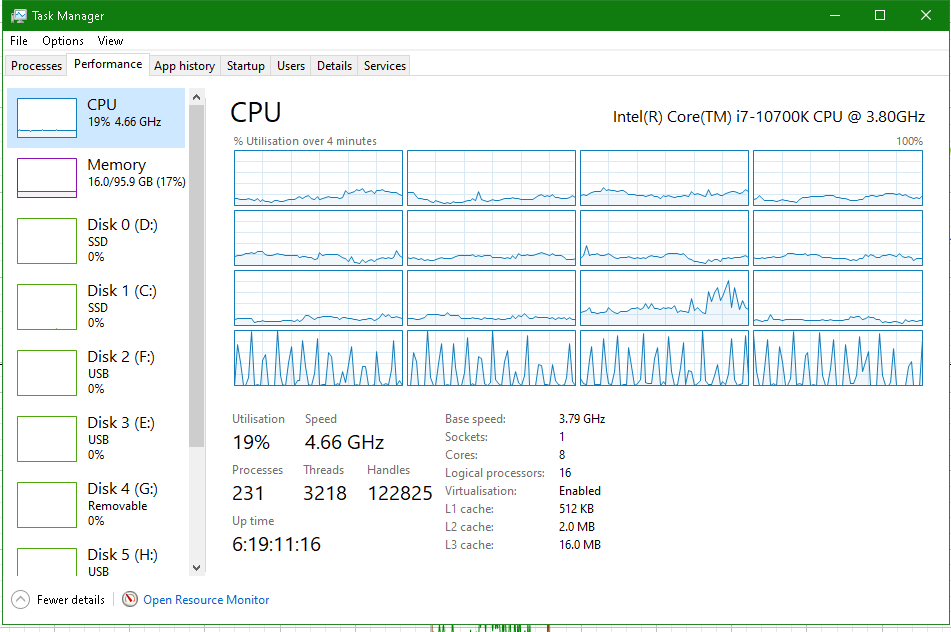
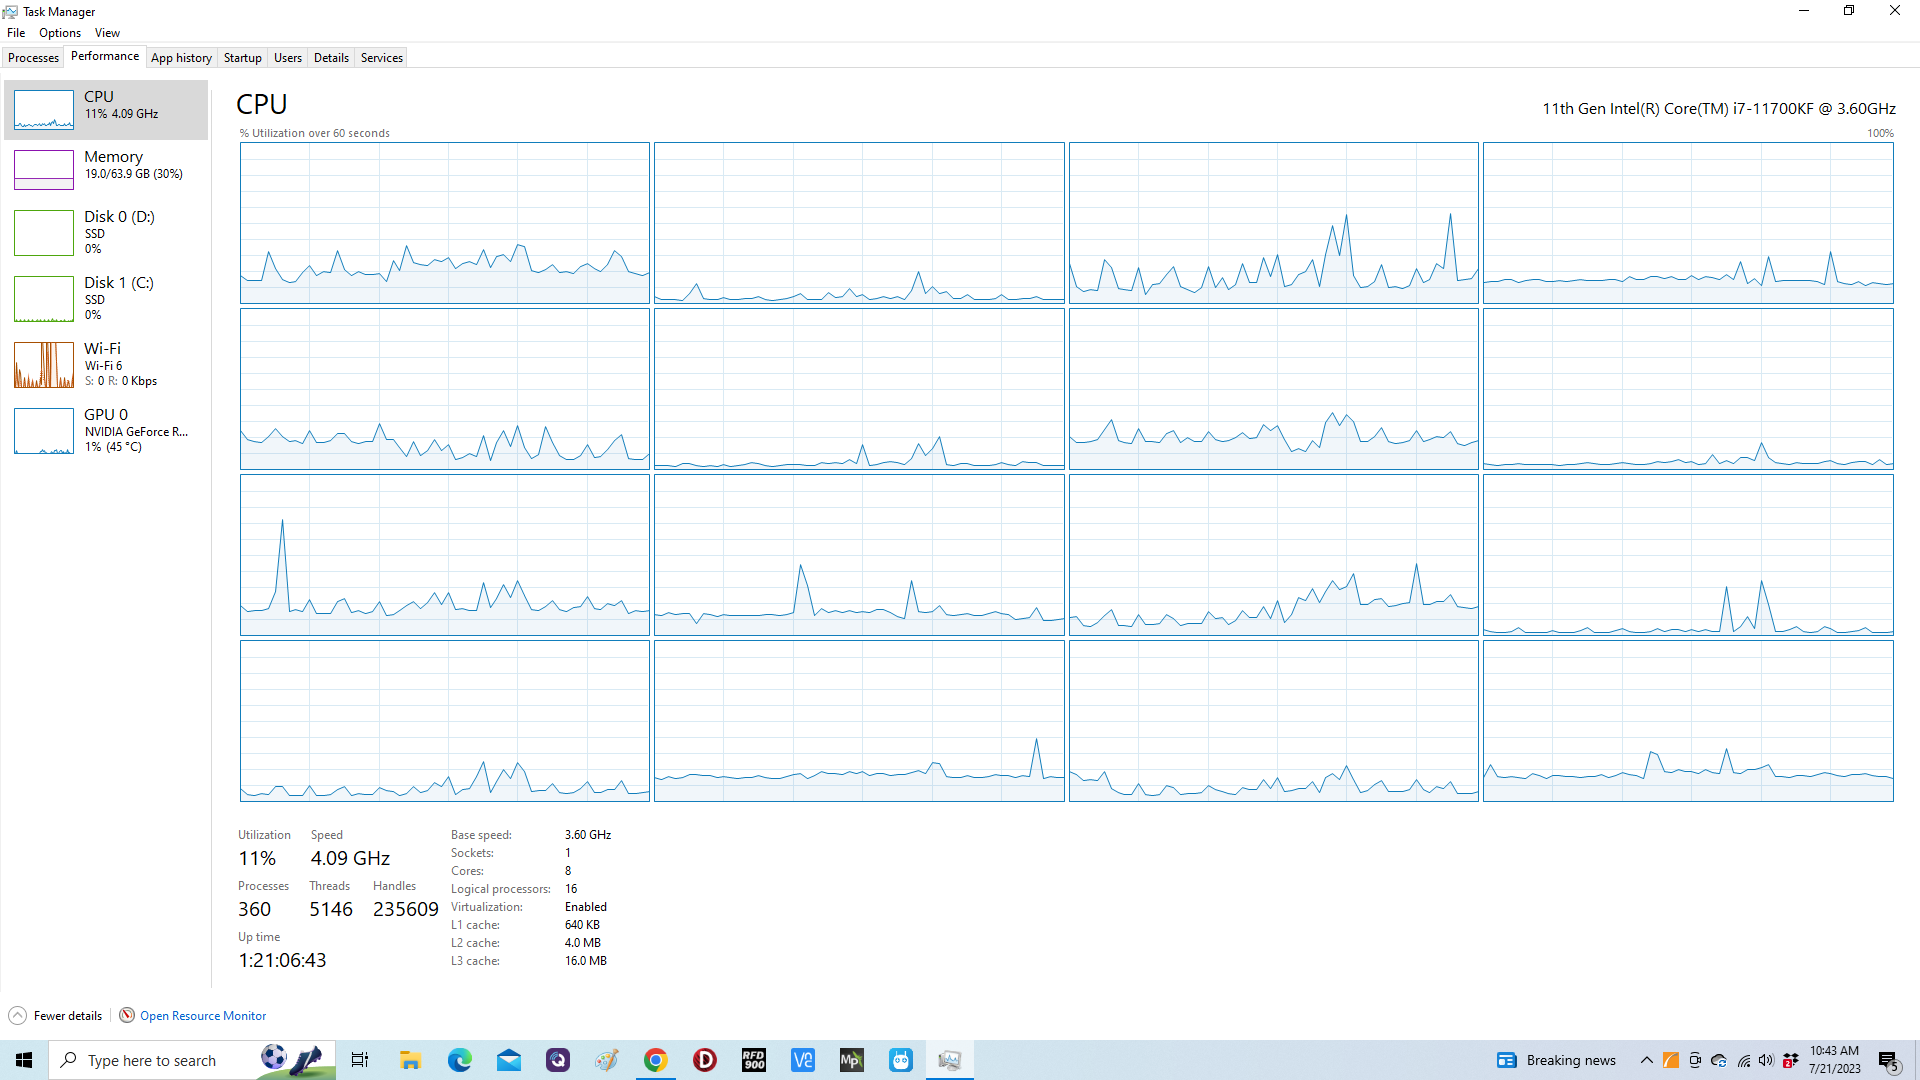
Here’s my utilization - now about 20 hours into processing. My i7 has 8 physical cores - 16 logical cores. I would expect very high memory utilization - but for some reason Task Manager shows it at less than 20%. (Pix4D would often show over 98% utilization.)
While processing a similar job in Pix4D might have taken about the same time, it would display much higher utilizations in various resources. However, to be fair - there were plenty of times when Pix4D displayed similarly low resource utilization.
At some point I’ll consider upgrading to an i9 for more cores, faster clock time, and DDR5 memory. But before I make that investment, I want to make sure I understand how WebODM is using my i7 -11700KF and the 64gig of DDR4 it has available.
I haven’t done any testing yet per Saijin’s suggestion - at this point I’m experimenting with the “edit” options to see the effects on processing time and output quality. When I get a little more comfortable with WebODM, I’d be glad to volunteer for testing.
I appreciate your helping out with my inquiry. Thank you!
With utilization at 11%, it does look like you’re using the equivalent of 1/2 to a full core (depending on what else is running), but it is a bit odd that the usage seems split across threads. It’ll be interesting if you see similar behavior when you run something smaller.
One thing the org is going to set up is bunch of test VMs with different parameterizarion, memory amounts, etc… Then we can externally better track resource usage, up to and including out of memory events. We’ll definitely be looking for feedback on what folks want to see tested.
It would be more comprehensive if you can give the CPU utilization with respect to the ODM processing stage.
Typically, feature extraction, feature matching, undistortion, dense pointcloud stages are highly parallelized, you should see high utilization in these stages. The reconstruction stage is partially parallelized, bundle adjustment is single-threaded and gets longer and longer while more images are added to the reconstruction. Your task manager graph seems only records the last 60s, so don’t have an idea exactly which stages could be. For example, for 1000 images, the last few bundle adjustment run could take tens of minutes to finish. That might be the reason you observed this. Also, if I remember correctly, windows manager seems record CPU usage percentage with all cores usage, so a fully used single core would not give you 100% usage there, instead showing 1 divided by the number of total cores.
If there’s a way to show project steps that ODM is computing, that might be helpful.
I expect this long period of low resource utilization is because of single threaded processing. But what I can’t figure out is why at least one of the cores doesn’t show high utilization.
It’s as if the process is doing a lot of paging - all within the same block of memory that’s been allocated.
Either that or there’s some sort of weird bottleneck like DMA access.
I get the feeling that most of the WebODM development has been done on Linux machines - so the Windows visibility to tuning may be limited by comparison.