I am super happy to join the OpenDroneMap community with FIELDimageR. My name is Filipe Matias and my research focus is plant science and agriculture. I’ve been using drone images to extract data from the agriculture field and applying this information in plant breeding. FIELDimageR is a compilation of functions in R language to analyze pos-orthomosaicing images.
WebODM and FIELDimageR is a perfect fit to develop an open-source pipeline in agriculture features. While WebODM easily and intuitively allows to build orthomosaics, FIELDimageR is used on the following steps of image analysis, making them a perfect combination. The pipeline proposed in FIEDLimageR starts by preparing the image: (i) cropping, (ii) removing soil and weeds, and (iii) rotating. This package also builds a plot shapefile in order to extract information for each plot, which can be used to evaluate different wavelengths, vegetation indices, stand count, canopy percentage, and plant height.
Please join me in this adventure with suggestions and feedback toward the development of this tool. All ideas are super welcome. This is an open channel to talk about remote sensing applied to agriculture.
Hi @Saijin_Naib,
Thank you for contacting me. I will try to address your questions below:
Q1: As for suggestions, do you think it would be possible to integrate FIELDImageR into WebODM as a plugin using the existing API?
A1: That’s a really good question. I am not sure, because although these tools complement each other they are independent and have different applications. But it’s something to think about.
Q2: Have you tested it with the R Processing Provider Plugin for QGIS?
A2: Unfortunately, I don’t have experience with R Processing Provider Plugin for QGIS. I will check it and let you know, but feel free to evaluate and share it with us.
Q3: And beyond that, any interest in making a native QGIS Plugin or Processing Algorithm so that analyses could be modeled/scripted inside of QGIS?
A3: That’s an amazing suggestion. I thought this when I was developing the pipeline but I feel more comfortable coding in R language. Please, contact me by private msg or email to schedule a Skype to talk better about that. Thank you…!!!
Hello to all,
@filipematias Filipe first thank you for your project and i have a question.
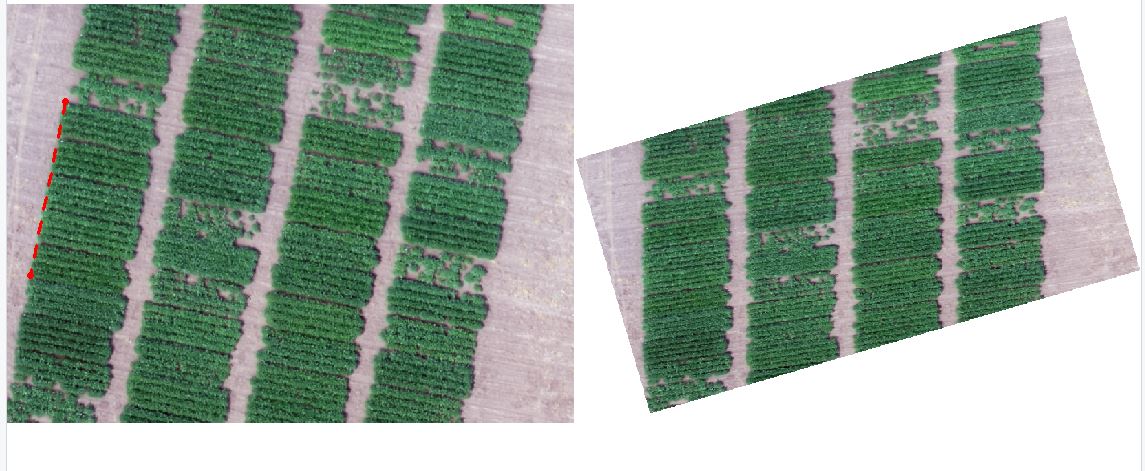
When i tried to rotate the image of the field with the plots, rows of the those plots twists in irregular way, so can you help me about it?
I attached image before and after image rotation with your code.
Thanks for answering! Unfortunately for me I’m moderatly illiterate in informatics… i could barely get webodm running with docker… i already installed r studio and r but i got stock running the field mapp R.
Is there a video tutorial on how appropriately install the required components and programs and how to run it?? Thanks again!! i need to count 100 hectares of lemon trees. I’m actually having problems with webodm mapping 2300 images it will result in error code 1 or child returned 137 error… i have 24g ram and i5 processor with 300g allocated for docker container. But i already processed with no problems in this same computer the orthomosaic with pix4d free trial version.!!
Hi @filipematias,
I tried everything and again I get the same mistake. Plant rows on my image are constantly distorted and because of that I cant create a grid of my plots with your function field Shape.
Is there any way to rotate the image in the right way, maybe with some other function?
Congratulations for the development of these orthophoto processing tools.**
I would like to know how can i calculate an NDVI when we have an orthophoto with three bands (Red, Green et Blue)?** Thank you for your help
I am a retired teacher from a vocational l training school in Spain,and I am doing a basic manual of crop monitoring, I managed to load the webodm and then I saw this wonderful project that although it is at another level for my objectives if it gives me ideas for crop monitoring, My questions are the following a) Where can you find a manual of the type of agrarian extension where they explain the issue of vegetation indices and crop monitoring? ; b) is there an affordable NIR camera or do you have experience with that of this other public project https://publiclab.org/wiki/infragram ? c) How far can you go in crop monitoring with just RGB data?. Thanks
A) Not sure of a good resource other than starting with the FieldImageR documentation/project contact:
B) Affordable in industry terms would lead you to something like the Parrot Sequoia or possibly the MicaSense RedEdge-Mx. There are also the MapIRSurvey3 and KERNEL cameras. Alternatively, you can convert an existing camera to Full Spectrum and use an appropriate filter, similar to the PublicLab InfraGram method. I used a GoPro Hero4 Black converted by Kolari Vision Infrared with their Blue/NIR NDVI Filter for agricultural field analysis.
C) Honestly, not far, despite how many unscrupulous people are willing to sell you that data as a service. Plants just don’t have much meaningful stress response in the visible bands that you wouldn’t be able to pick up on standing in/near the field. It doesn’t really help you predict and get ahead of any problems. They show much more of their stress response in the NIR and sometimes thermal bands.
Thanks for advices…can be in future webodm NIRcam hardware with all features added to webodm program?..This would facilitate access to work in ecosystem services for groups that are not so fine in the state of the art … I think that is the spirit of webodm … if a crowdfounding has to be set up, I offer myself to collaborate.

 !
!
 i could barely get webodm running with docker… i already installed r studio and r but i got stock running the field mapp R.
 i need to count 100 hectares of lemon trees. I’m actually having problems with webodm mapping 2300 images it will result in error code 1 or child returned 137 error… i have 24g ram and i5 processor with 300g allocated for docker container. But i already processed with no problems in this same computer the orthomosaic with pix4d free trial version.!!