In addition to your suggestion, it looked like enabling No GPU would be a good idea. Re-processing now.
1 Like
Yes, not a bad idea to explicitly use the parameter, especially since people read old posts like this, and if we add dsp-sift to GPU processing in the future, my recommendation would no longer work.
I’ve written about it on the Community a number of times, but in summary:
Very much the same situation as GPU video encode vs CPU video encode. We’ve had GPU encoding in consumer parts for about 30 years now, and GPU video encoding is still nowhere near as high-quality/compression as CPU-based. Significantly faster? Absolutely! Good enough? Yes! Absolute best quality? Not by a long shot.
GPU features are more or less the same at this juncture. If you must have the best reconstruction, you’ll need CPU-based, especially Piero’s DSP SIFT implementation that improves upon SIFT in difficult scenery significantly.
2 Likes
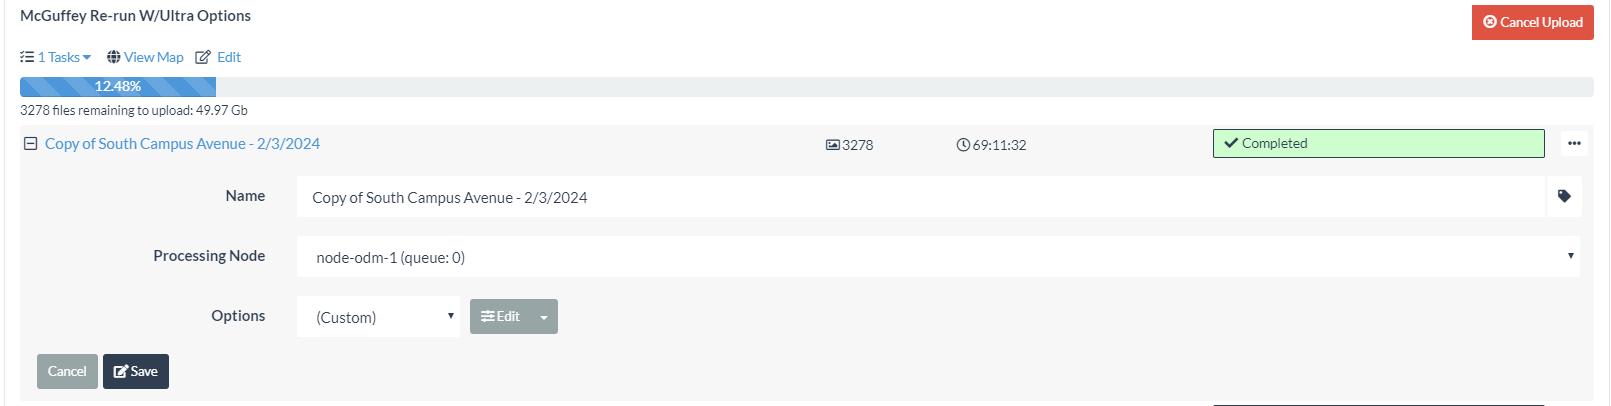
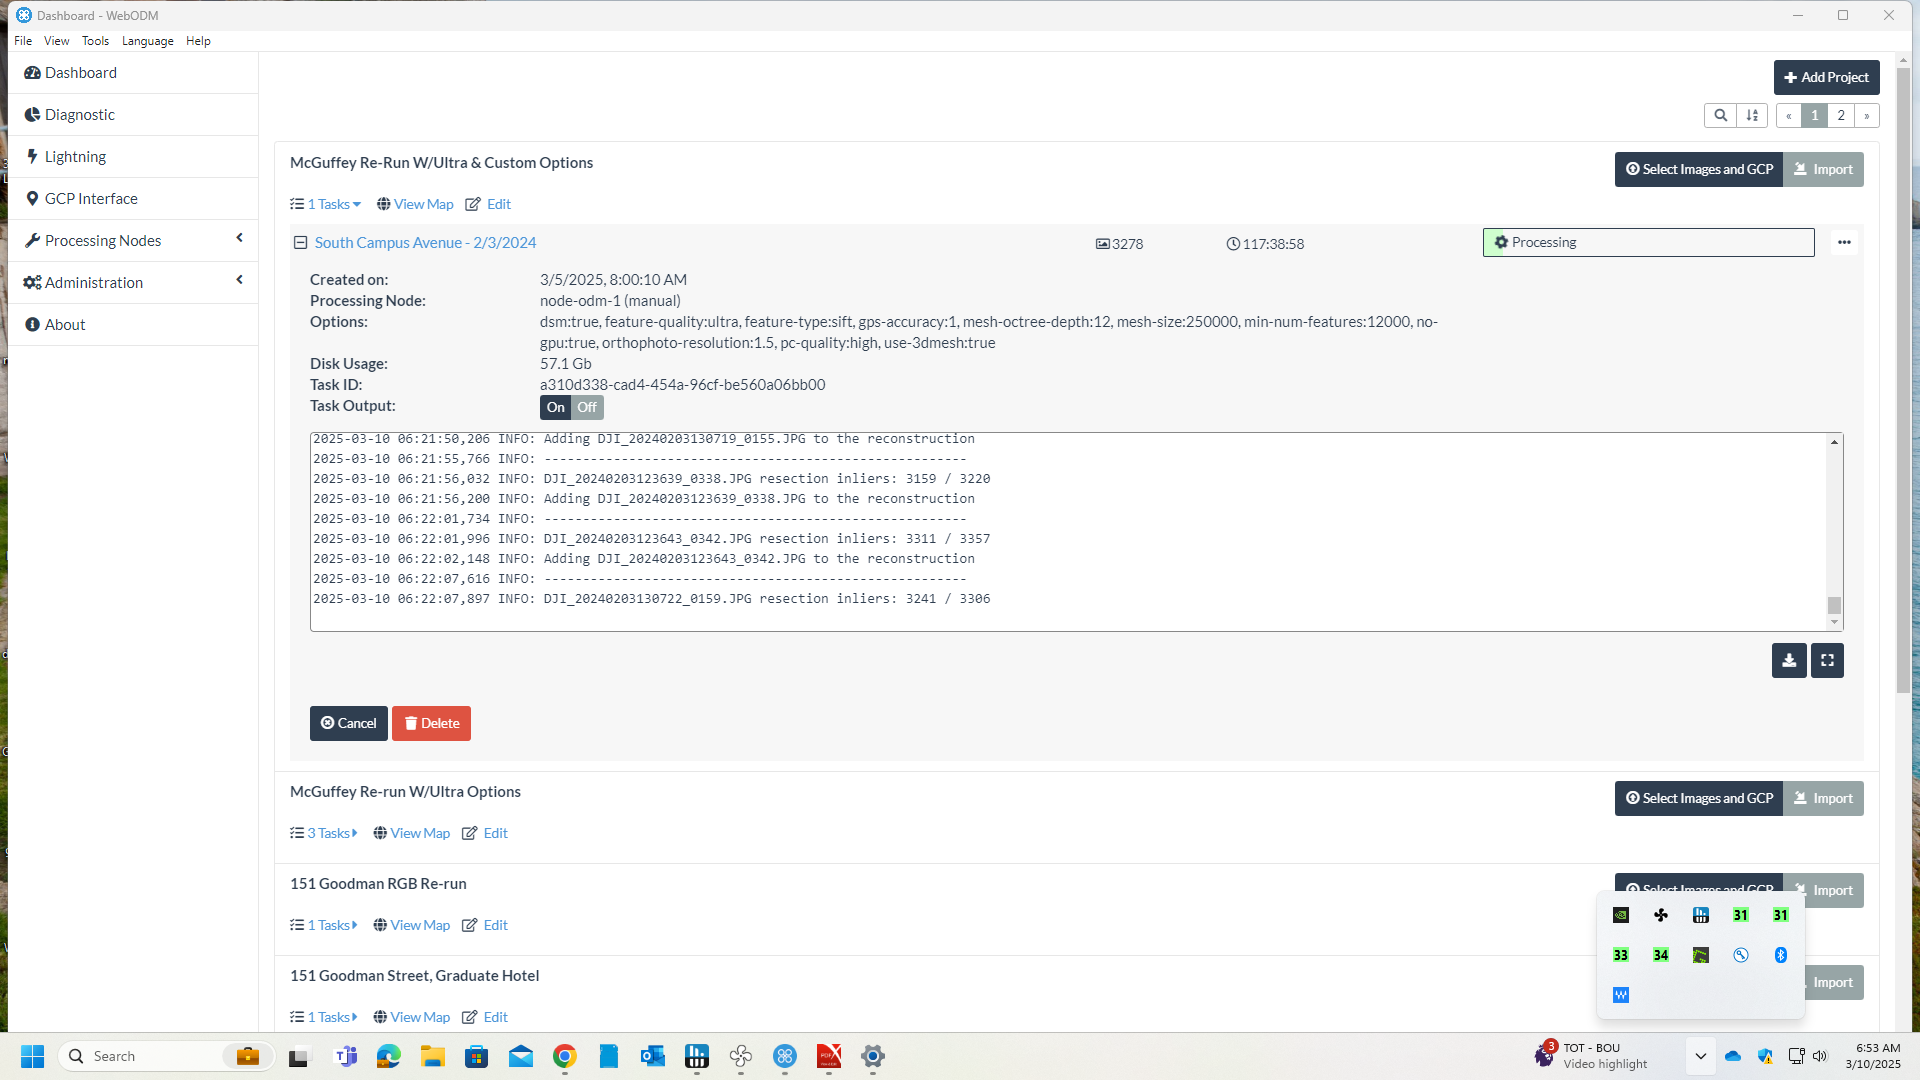
Very helpful explanation, thanks to both of you. FYI, I’m at 85 Hours, 4 Minutes on this latest run. Here’s a screenshot…

Two Questions - The degradation in output quality with GPU processing applies even when using high-end cards, pro cards? I realize my NVIDIA Quadro RTX 5000’s are somewhat dated, but they are considered pro-level )vs consumer) quality. I’ve been contemplating an upgrade to a pair of RTX A5500’s that offer much better specs - especially in operations/second (almost triple).
Saijin, if you could point me to where you have written about this, I would appreciate reading up on this.
Is there a post, blog or article I can review that will help me understand what is happening in the console log at each pipeline stage?
This morning I’m posting a screengrab of the current processing effort. - nearly 98 hours and counting. This is the first time this dataset has run this long, and the Processing bar has not moved much.
If I can get some insight to what the log is recording, I should be able to determine what parameter changes are causing the slowdown.
Thanks again,
DMF

Do you need feature-quality ultra? Have you run this with feature-quality high and decided it wasn’t good enough? feature-quality ultra will make your OpenSfM step run for roughly 4x using high.
That said, at 90 hours if you’re still in matching with that process, even with 3200 images, something else has gone wrong. Is the log still updating?
For reference, I recently processed a 2400 image dataset with feature-quality and pc-quality both turned up to ultra and the total processing time inclusive of depthmaps was 60 hours on my relatively slow, 10yo machine, which is ~20% slower than your CPU for single threaded processes.
Short an understanding of why things are running slowly, here is the approach I would recommend: split your dataset into to overlapping subsets. Make sure they overlap by two passes of your drone. Process the first dataset all the way through. Then upload your second dataset and prior to processing, choose the first dataset as your alignment dataset, like this:
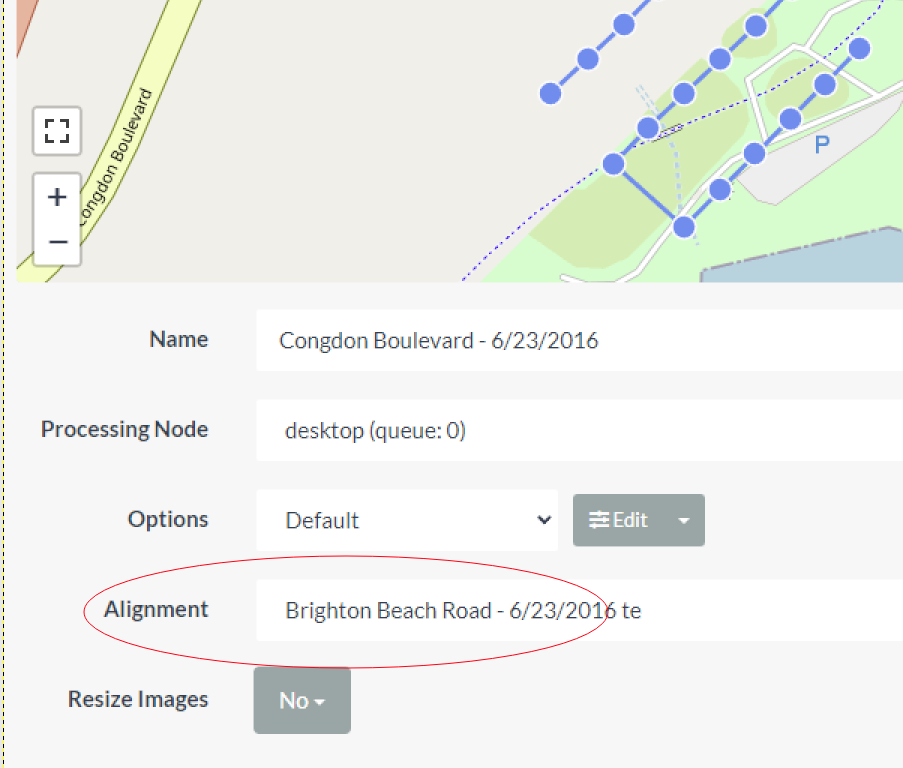
Then, the final products will be quite nicely aligned and you can merge them together separately as necessary.
I’m aiming this year to potentially rewrite split-merge to automatically use this workflow, as opposed to it’s current approach, as it works quite flawlessly in aligning datasets.
1 Like
Thanks so much fo the quick response and guidance. Yes, still running., nearly 109 hours.
The log is still updating.
If there is a way to look through the log for a confirmation of an issue, I’m happy to do that or upload the log. Let me know.
Otherwise, I’ll let it run overnight and see where we’re at in the morning.
The fact that it is still matching, not even computing your structure yet at that length of time is unreasonably slow. With that CPU, you shouldn’t take that long with that many images.
Nothing in the logs I can think of will help us at this stage, but I guess another couple questions:
- Are you running on slow spinning media, a network drive, or a fast disk?
- When you’re done running, can you run the Brighton Beach dataset through and report back your processing time? GitHub - pierotofy/drone_dataset_brighton_beach
- What size are your images?
Media - The OS and WebODM are on a Samsung SSD 990 Pro
Yep, I can do that.
Image - 3278 = 53.1GB, 8192x5460 px, smallest is 7.7MB, largest is 26.1MB
Shot with a Zenmuse P1, 35mm lens.
Let me know if you need anything else.
DMF
Ah, a full frame 45MP camera running on ultra? That’d slow you down.
My general recommendations for approaching a dataset like this:
- First, select a contiguous subset of the data to process first.
- Run that subset through once first with defaults (dsm: true; auto-boundary:true)
- Then run the whole dataset through with defaults
- Monitor your resource usage and time for both. Look particularly to the time it takes to run the following two stages:
- Structure from Motion (OpenSfM)
- Multiview Stereo (OpenMVS)
- From there, modify
- feature-quality, which will impact the processing time for OpenSfM
- each higher level is a 4x time increase from the prior level
- pc-quality, will impact the processing time for OpenMVS
- each higher level is a 4x time increase from the prior level
- feature-quality, which will impact the processing time for OpenSfM
In that way, you’ll have a baseline estimate for time (the default), and so as you increase your feature-quality and pc-quality, you will be able to estimate what impact that will have on processing time.
Touch back in once you’ve run the whole dataset on defaults and I can provide some additional strategies for improving any outputs. I suspect you’ll need to split this dataset to be effective, but my recommendations for how to approach that will depend, in part, on what your results from processing on defaults yield.
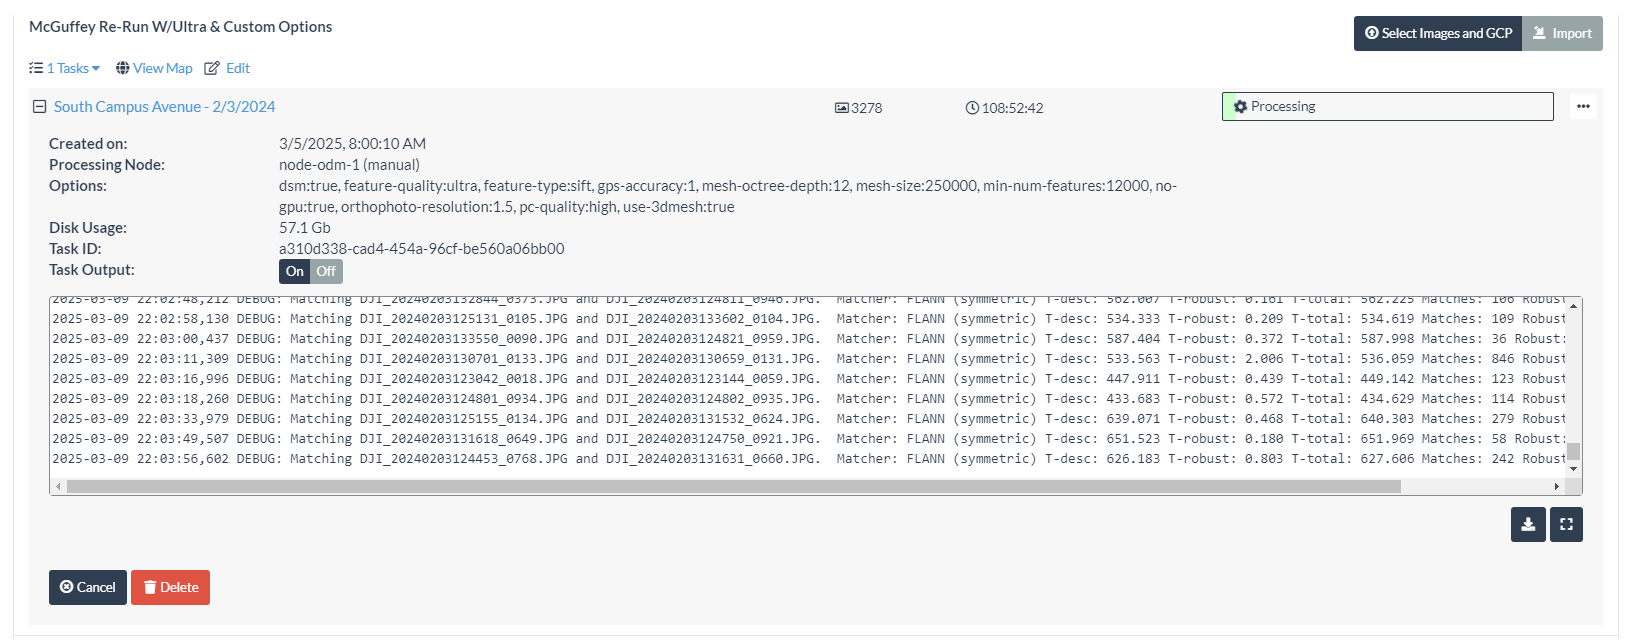
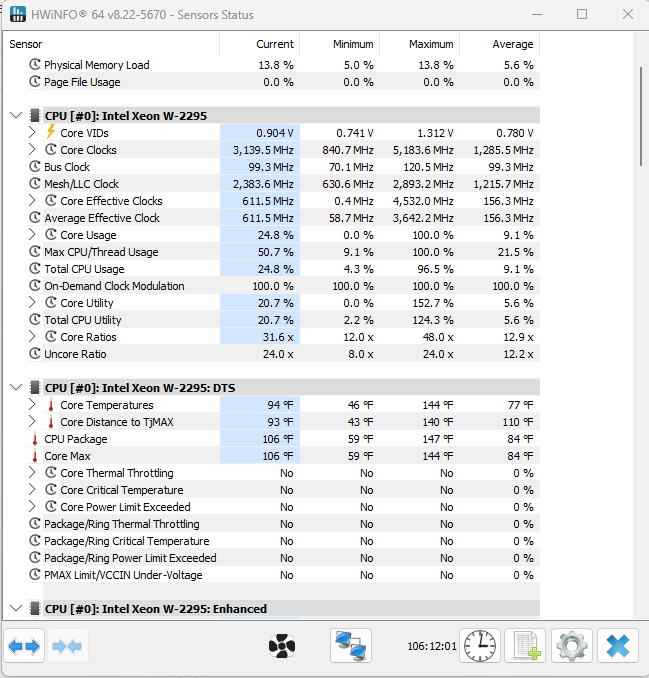
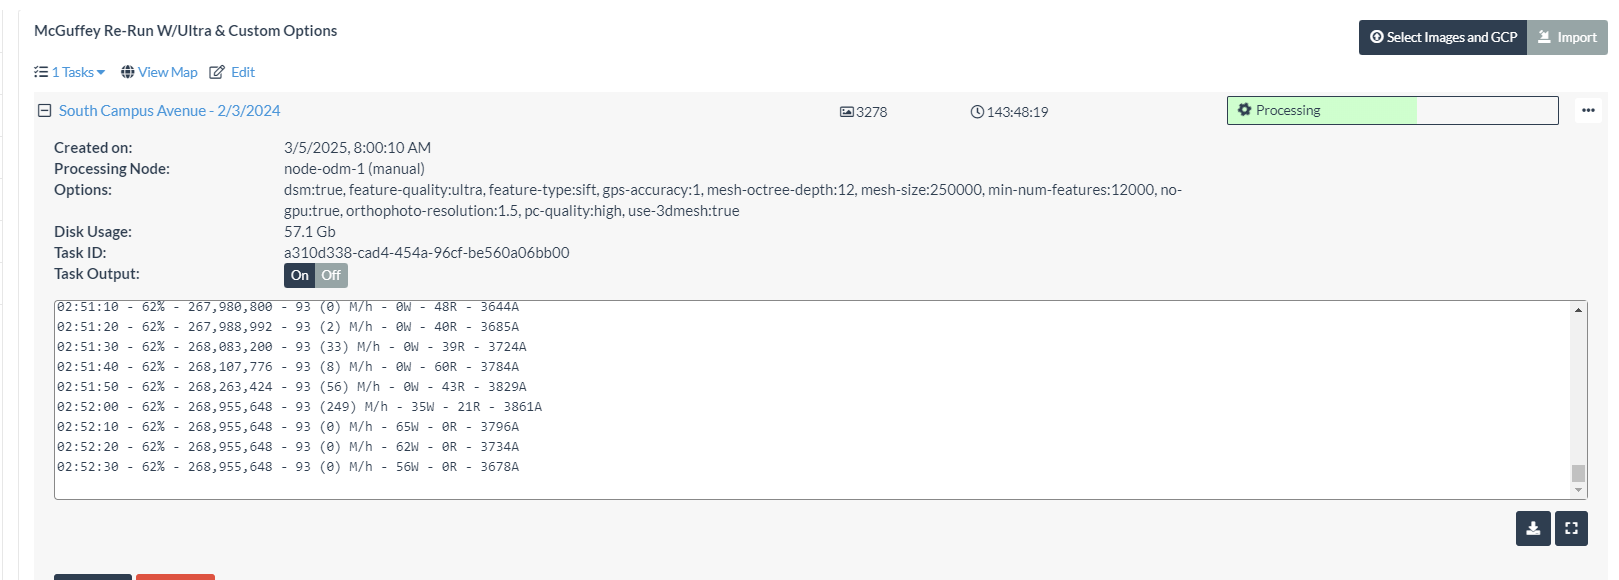
Great insight, this is what I’ve been trying to understand. FYI, looks like we’ve moved on from matching, see the attached. Also took a screen grab with HWiNFO64 running, CPO was running close to 100%.

Still processing -
179 HRS 39MIN
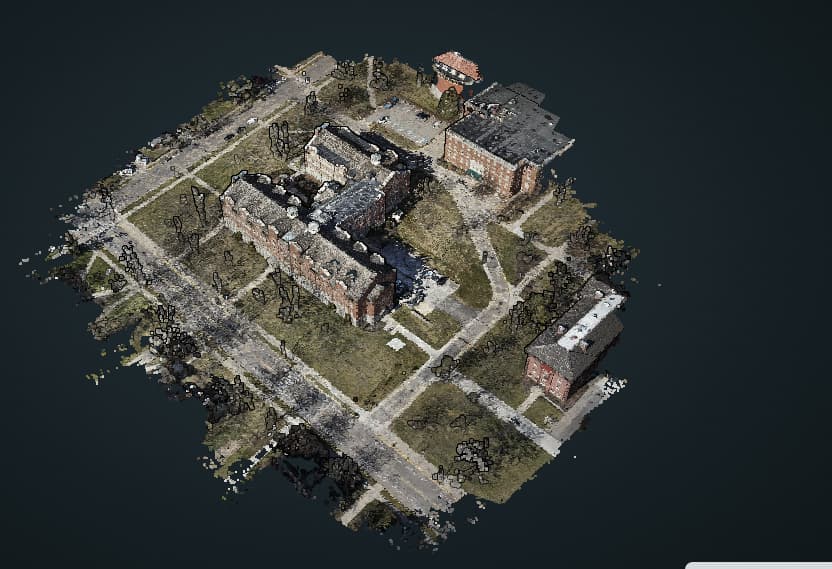
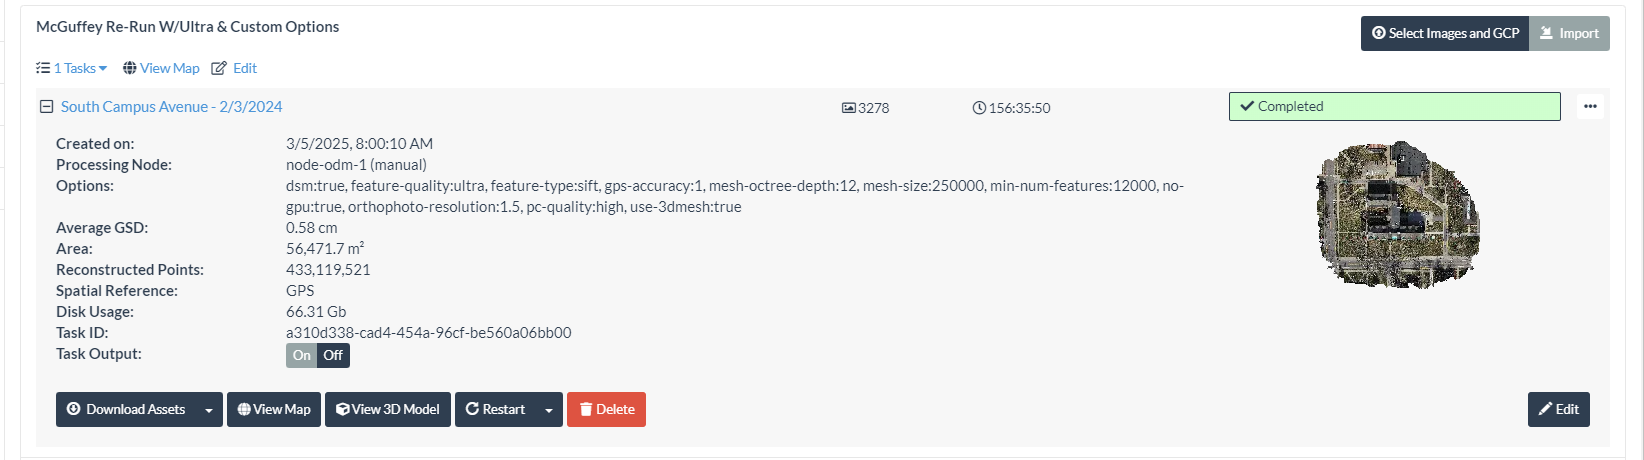
Processing completed last night after 156:35:50. The output looks fair, I can’t say I’m over the moon, but at least it doesn’t look like it was tossed into a Waring Blender!
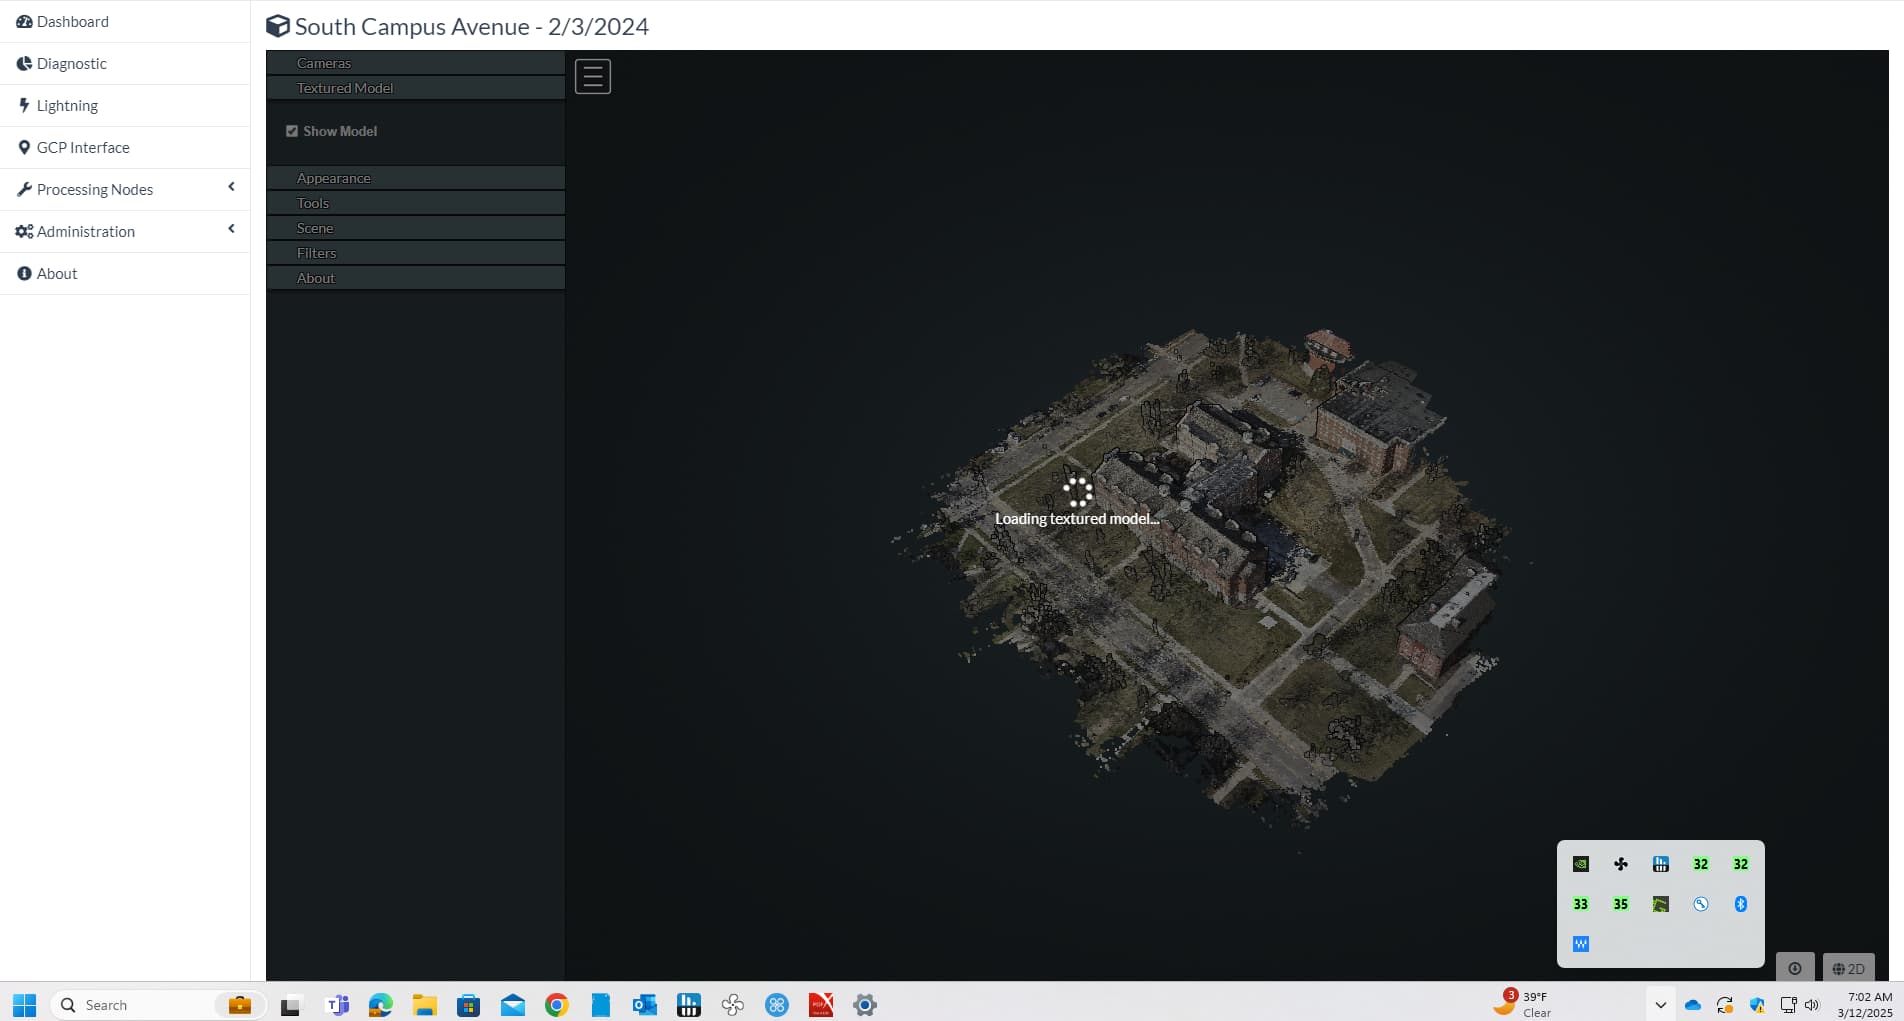
I stared to look at the 3D model last night and it it took quite a while to load, then when it did, all I saw was a white screen. Screen shots are posted, if you want the log, let me know.
I’m seriously considering chucking this hardware for a better performing Xeon, or if there’s something else I should be looking at, I’m open to suggestions. I’m looking at a PCIE Gen 5 ThinkStation with a Xeon W9-3475X, 256GB RAM and dual RTX A5500 GPUs.Still researching this config to verify water blocks are available and compatible.

This topic was automatically closed 30 days after the last reply. New replies are no longer allowed.